Non-Insured Health Benefits program: First Nations and Inuit Health Branch: Annual report 2019 to 2020
PDF Version (4.27 Mb, 100 pages)
On this page
- Section 1: Overview
- Section 2: Client population
- Section 3: NIHB program benefit expenditures
- Section 4: NIHB pharmacy expenditure and utilization data
- Section 5: NIHB dental expenditure and utilization data
- Section 6: NIHB Medical transportation expenditure and utilization data
- Section 7: NIHB vision benefits, mental health counselling benefits and other health care benefits data
- Section 8: Regional expenditure trends
- Section 9: NIHB program administration
- Section 10: NIHB policy and program initiatives
- Section 11: Technical notes
Section 1: Overview
Introduction
The Non-Insured Health Benefits (NIHB) program provides registered First Nations and recognized Inuit with coverage for a range of medically necessary health benefits including prescription drugs and over-the-counter (OTC) medications, dental and vision care, medical supplies and equipment, mental health counselling, and transportation to access medically required health services that are not available on reserve or in the community of residence. This report covers the 2019 to 2020 fiscal year. A fiscal year runs from April 1 to March 31. During 2019 to 2020, NIHB provided access to benefits coverage to 887,518 eligible clients.
In line with Canada's commitments under the United Nations Declaration of the Rights of Indigenous Peoples and the Truth and Reconciliation Commission's Calls to Action, Indigenous Services Canada (ISC) works with Indigenous organizations including the Assembly of First Nations and the Inuit Tapiriit Kanatami, to advance shared priorities focused on improving and closing the gaps in health outcomes for Indigenous peoples.
Now in its 26th edition, the 2019 to 2020 NIHB Annual Report provides national and regional data on the NIHB program client population, expenditures, benefit types and benefit utilization. This report is published in accordance with the NIHB program's performance management responsibilities and is intended for the following target audiences:
- First Nations and Inuit organizations and governments at community, regional and national levels
- regional and Headquarters managers and staff of Indigenous Services Canada
- others in government and in non-government organizations with an interest in the provision of health services to First Nations and Inuit communities
British Columbia Tripartite Agreement
The British Columbia Tripartite Framework Agreement on First Nation Health Governance was signed by Canada, the First Nations Health Council (FNHC) and the British Columbia Ministry of Health on October 13, 2011. Consistent with the commitments set out in the Framework agreement, between July 2, 2013 and October 1, 2013 the First Nations Health Authority (FNHA) assumed responsibility for the design, management, delivery or the funding of the delivery of health services to First Nations residing in British Columbia. Since that time, First Nations individuals residing in BC have received their health benefits through the FNHA's Health Benefits Program, which replaced the NIHB program in BC.
Section 2: Client population
To be an eligible client of the NIHB program, an individual must be a resident of Canada and one of the following:
- a First Nations person who is registered under the Indian Act
- an Inuk recognized by an Inuit Land Claim organization
- a child less than 18 months old whose parent is a registered First Nations person or a recognized Inuk
As of March 31, 2020, there were 887,518 First Nations and Inuit clients eligible to receive benefits under the NIHB program, an increase of 1.6% from March, 2019.
First Nations and Inuit population data are drawn from the Status Verification System (SVS) which is operated by the NIHB program. SVS data on First Nations clients are based on information provided by Indigenous Services Canada. SVS data on Inuit clients are based on information provided by the Governments of the Northwest Territories and Nunavut, and Inuit organizations including the Inuvialuit Regional Corporation, Nunavut Tunngavik Incorporated and the Makivik Corporation.
Amendments to the Indian Act have meant that a greater number of individuals are able to claim or restore their status as registered Indians. Bill C-3, The Gender Equity in Indian Registration Act, which came into force on January 31, 2011, and Bill S-3, An Act to amend the Indian Act in response to the Superior Court of Quebec decision in Descheneaux c. Canada, which came into force December 12, 2017, aim to eliminate known sex-based inequities in registration. Because of this, many people became entitled to be registered as an Indian in accordance with the Indian Act. Once registered under the Indian Act, these individuals are eligible to receive benefits through the NIHB program.
The creation of the Qalipu Mi'kmaq First Nations band was announced on September 26, 2011 as a result of a settlement agreement that was negotiated between the Government of Canada and the Federation of Newfoundland Indians (FNI). Through the formation of this band, members of the Qalipu Mi'kmaq became recognized under the Indian Act and eligible for registration.
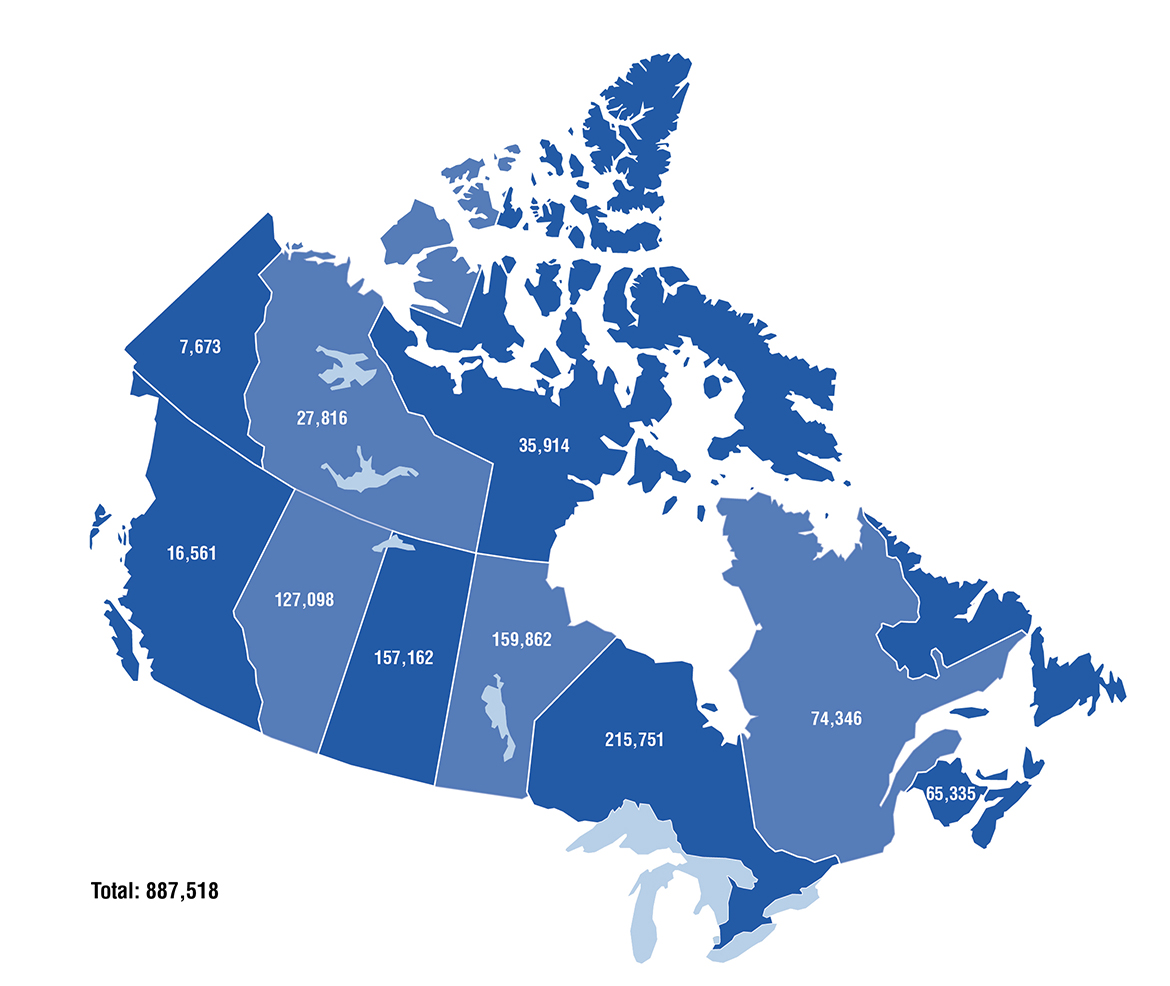
Figure 2.1: Eligible client population by region: March 2020
Ontario had the largest proportion of the eligible population, representing 24.3% of the national total, followed by Manitoba at 18.0% and Saskatchewan at 17.7%.
Figure 2.1 lists population values based on region of band registration, which is not necessarily the client's current region of residence. The majority of British Columbia clients previously covered by the NIHB program are now covered by the B.C. First Nations Health Authority (FNHA) and are not represented in this chart. The remaining NIHB clients in B.C. are Inuit clients, or clients associated with B.C. bands, but residing in other provinces and territories of Canada (where they are covered under the NIHB program).
Source: SVS adapted by Business Support, Audit and Negotiations Division
Text alternative for Figure 2.1: Eligible client population by region: March 2020
This image is a map of Canada with population values:
- Atlantic has 65,335
- Quebec has 74,346
- Ontario has 215,751
- Manitoba has 159,862
- Saskatchewan has 157,162
- Alberta has 127,098
- British Columbia has 16,561
- Yukon has 7,673
- Northwest Territories have 27,816
- Nunavut has 35,914
- Total eligible population is 887,518
Figure 2.2: Eligible client population by type and region: March 2019 and March 2020
Of the 887,518 total eligible clients at the end of the 2019 to 2020 fiscal year, 837,807 (94.4%) were First Nations clients while 49,711 (5.6%) were Inuit clients. The number of First Nations clients increased by 1.6% and the number of Inuit clients increased by 2.6%.
From March 2019 to March 2020, Nunavut had the highest percentage change in total eligible clients with a 3.3% increase, followed by the Atlantic region and Quebec with increases of 2.3% and 2.0% respectively.
| Region | First Nations | Inuit | Total | % Change 2019 to 2020 | |||
|---|---|---|---|---|---|---|---|
| March 2019 | March 2020 | March 2019 | March 2020 | March 2019 | March 2020 | ||
| Atlantic | 63,482 | 64,924 | 391 | 411 | 63,873 | 65,335 | 2.3% |
| Quebec | 71,298 | 72,652 | 1,584 | 1,694 | 72,882 | 74,346 | 2.0% |
| Ontario | 211,353 | 214,893 | 823 | 858 | 212,176 | 215,751 | 1.7% |
| Manitoba | 157,103 | 159,634 | 222 | 228 | 157,325 | 159,862 | 1.6% |
| Saskatchewan | 154,240 | 157,073 | 83 | 89 | 154,323 | 157,162 | 1.8% |
| Alberta | 124,517 | 126,381 | 692 | 717 | 125,209 | 127,098 | 1.5% |
| B.C. | 17,044 | 16,182 | 373 | 379 | 17,417 | 16,561 | -4.9% |
| Yukon | 7,457 | 7,545 | 122 | 128 | 7,579 | 7,673 | 1.2% |
| Northwest Territories | 18,364 | 18,523 | 9,407 | 9,293 | 27,771 | 27,816 | 0.2% |
| Nunavut | 0 | 0 | 34,757 | 35,914 | 34,757 | 35,914 | 3.3% |
| National | 824,858 | 837,807 | 48,454 | 49,711 | 873,312 | 887,518 | 1.6% |
| Source: SVS adapted by Business Support, Audit and Negotiations Division | |||||||
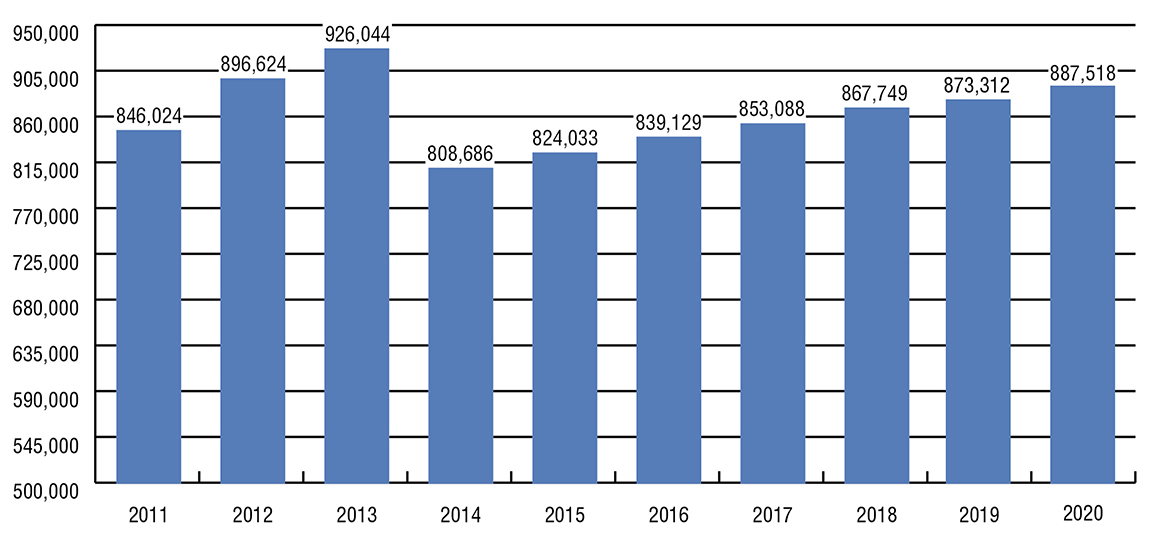
Figure 2.3: Eligible client population
Over the past 10 years, the total number of eligible clients in the SVS has increased by 4.9%, from 846,024 in March 2011 to 887,518 in March 2020.
The NIHB program client population was significantly impacted during this period by amendments to the Indian Act affecting client eligibility and by the creation of the FNHA in British Columbia, which resulted in approximately 133,430 clients in B.C. being removed from the NIHB client population when they became eligible to receive benefits through the FNHA.
Figure 2.3.1: Eligible client population, March 2011 to March 2020
Source: SVS adapted by Business Support, Audit and Negotiations Division
Text alternative for Figure 2.3.1: Eligible client population, March 2011 to March 2020
This image visually describes NIHB eligible population growth over 10 years as follows:
- in 2011 the NIHB eligible population was 846,024
- in 2012 the NIHB eligible population was 896,624
- in 2013 the NIHB eligible population was 926,044
- in 2014 the NIHB eligible population was 080,686
- in 2015 the NIHB eligible population was 824,033
- in 2016 the NIHB eligible population was 839,129
- in 2017 the NIHB eligible population was 853,088
- in 2018 the NIHB eligible population was 867,749
- in 2019 the NIHB eligible population was 873,312
- in 2020 the NIHB eligible population was 887,518
Over the past 5 years, the NIHB program's total number of eligible clients increased by 5.8% from 839,129 in March 2016 to 887,518 in March 2020. Saskatchewan had the largest increase in eligible clients over this period, with a growth rate of 7.7%. The regions of Alberta and Quebec followed with growth rates of 7.6% and 6.6% respectively.
Figure 2.3.2: Eligible client population by region, March 2016 to March 2020
| Region | March 2016 | March 2017 | March 2018 | March 2019 | March 2020 |
|---|---|---|---|---|---|
| Atlantic | 63,712 | 64,733 | 65,573 | 63,873 | 65,335 |
| Quebec | 69,758 | 70,930 | 72,151 | 72,882 | 74,346 |
| Ontario | 204,232 | 207,266 | 210,295 | 212,176 | 215,751 |
| Manitoba | 150,475 | 152,874 | 155,850 | 157,325 | 159,862 |
| Saskatchewan | 145,968 | 148,953 | 152,324 | 154,323 | 157,162 |
| Alberta | 118,170 | 121,095 | 123,812 | 125,209 | 127,098 |
| B.C. | 19,277 | 18,607 | 18,184 | 17,417 | 16,561 |
| Yukon | 7,456 | 7,490 | 7,604 | 7,579 | 7,673 |
| Northwest Territories | 26,367 | 26,616 | 26,877 | 27,771 | 27,816 |
| Nunavut | 33,714 | 34,524 | 35,079 | 34,757 | 35,914 |
| Total | 839,129 | 853,088 | 867,749 | 873,312 | 887,518 |
| Annual % change | 1.8% | 1.7% | 1.7% | 0.6% | 1.6% |
| Source: SVS adapted by Business Support, Audit and Negotiations Division | |||||
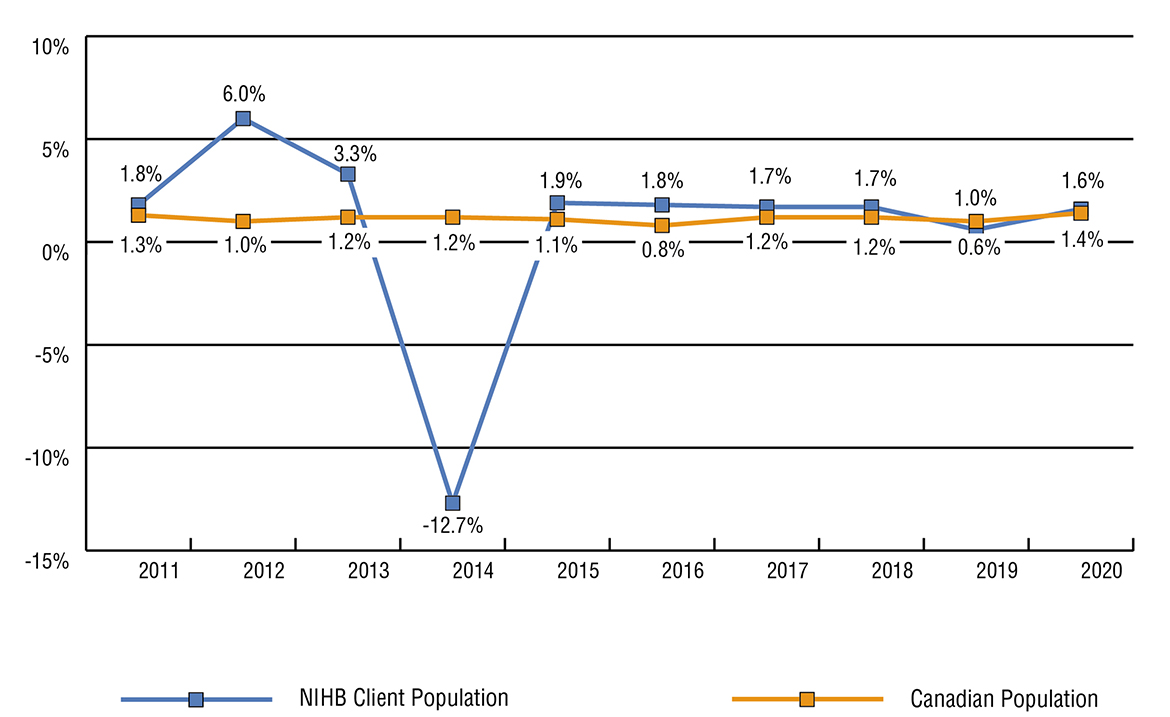
Figure 2.4: Annual population growth, Canadian population and eligible client population: 2011 to 2020
From 2011 to 2020, the Canadian population increased by 10.5% while the NIHB eligible First Nations and Inuit client population increased by 4.9%. Factoring out the impact of the removal of FNHA clients, the NIHB 10 year eligible population increase was 24.4%, with an average annual growth of 2.2%.
The higher than average NIHB program client population growth rate of 6.0% in 2011 to 2012 and 3.3% in 2012 to 2013 can be attributed to the registration of clients newly eligible under Bill C-3 as status Indians, and to new Qalipu Mi'kmaq First Nations clients in the Atlantic region.
Source: SVS and Statistics Canada Catalogue No. 91-002-XWE, Quarterly Demographic Statistics, adapted by Business Support, Audit and Negotiations Division
Text alternative for Figure 2.4: Annual population growth, Canadian population and eligible client population: 2011 to 2020
This image visually describes annual population growth for the NIHB eligible population and for the Canadian population.
| Year | 2011 | 2012 | 2013 | 2014 | 2015 | 2016 | 2017 | 2018 | 2019 | 2020 |
|---|---|---|---|---|---|---|---|---|---|---|
| NIHB client Population | 846,024 | 896,624 | 926,044 | 808,686 | 824,033 | 839,129 | 853,088 | 867,749 | 873,312 | 887,518 |
| Growth rate | 1.8% | 6.0% | 3.3% | -12.7% | 1.9% | 1.8% | 1.7% | 1.7% | 0.6% | 1.6% |
| Canadian population | 34,019,000 | 34,349,236 | 34,754,312 | 35,152,370 | 35,535,348 | 35,832,513 | 36,264,604 | 36,708,083 | 37,058,856 | 37,589,262 |
| Growth rate | 1.3% | 1.0% | 1.2% | 1.2% | 1.1% | 0.8% | 1.2% | 1.2% | 1.0% | 1.4% |
Figure 2.5: Eligible client population by age group, gender and region: March 2020
Of the 887,518 NIHB eligible clients on the SVS as of March 31, 2020, 49.2% were male (436,748) and 50.8% were female (450,770).
The average age of the eligible client population was 34 years of age. By region, this average ranged from a low of 27 years of age in Nunavut to a high of 41 years of age in British Columbia.
The average age of the male and female eligible client population was 33 years and 35 years respectively. The average age for males ranged from a low of 27 years in Nunavut to a high of 39 years in British Columbia. The average age for females varied from a low of 28 years in Nunavut to a high of 43 years in British Columbia.
The NIHB eligible client population is relatively young with nearly two-thirds (63.2%) under the age of 40. Of the total population, almost one-third (30.9%) are under the age of 20.
The senior population (clients 65 years of age and over) has been slowly increasing as a proportion of the total NIHB client population. In 2010 to 2011, seniors represented 6.4% of the overall NIHB population. Most recently in 2019 to 2020, seniors accounted for 9.0%.
| Region | Atlantic | Quebec | Ontario | Manitoba | ||||||||
|---|---|---|---|---|---|---|---|---|---|---|---|---|
| Age group | Male | Female | Total | Male | Female | Total | Male | Female | Total | Male | Female | Total |
| 0-4 | 1,282 | 1,238 | 2,520 | 1,560 | 1,447 | 3,007 | 3,838 | 3,563 | 7,401 | 4,492 | 4,278 | 8,770 |
| 5-9 | 2,083 | 2,118 | 4,201 | 2,484 | 2,380 | 4,864 | 7,156 | 6,976 | 14,132 | 8,113 | 7,710 | 15,823 |
| 10-14 | 2,564 | 2,398 | 4,962 | 2,870 | 2,665 | 5,535 | 8,100 | 7,730 | 15,830 | 8,631 | 8,545 | 17,176 |
| 15-19 | 2,511 | 2,388 | 4,899 | 2,706 | 2,571 | 5,277 | 8,184 | 7,885 | 16,069 | 7,644 | 7,242 | 14,886 |
| 20-24 | 2,634 | 2,586 | 5,220 | 2,840 | 2,797 | 5,637 | 8,906 | 8,504 | 17,410 | 7,548 | 7,205 | 14,753 |
| 25-29 | 2,744 | 2,691 | 5,435 | 3,133 | 3,024 | 6,157 | 9,240 | 9,040 | 18,280 | 7,620 | 7,467 | 15,087 |
| 30-34 | 2,444 | 2,364 | 4,808 | 2,662 | 2,737 | 5,399 | 8,330 | 8,139 | 16,469 | 6,265 | 6,161 | 12,426 |
| 35-39 | 2,202 | 2,276 | 4,478 | 2,412 | 2,397 | 4,809 | 7,268 | 7,468 | 14,736 | 5,249 | 5,068 | 10,317 |
| 40-44 | 2,072 | 2,098 | 4,170 | 2,264 | 2,260 | 4,524 | 6,855 | 6,950 | 13,805 | 4,557 | 4,508 | 9,065 |
| 45-49 | 2,219 | 2,172 | 4,391 | 2,245 | 2,386 | 4,631 | 6,763 | 6,988 | 13,751 | 4,481 | 4,610 | 9,091 |
| 50-54 | 2,226 | 2,385 | 4,611 | 2,344 | 2,580 | 4,924 | 6,932 | 7,223 | 14,155 | 4,279 | 4,441 | 8,720 |
| 55-59 | 2,012 | 2,283 | 4,295 | 2,408 | 2,656 | 5,064 | 6,777 | 7,513 | 14,290 | 3,685 | 4,026 | 7,711 |
| 60-64 | 1,701 | 1,965 | 3,666 | 1,967 | 2,507 | 4,474 | 5,566 | 6,632 | 12,198 | 2,650 | 2,978 | 5,628 |
| 65+ | 3,344 | 4,335 | 7,679 | 4,107 | 5,937 | 10,044 | 11,089 | 16,136 | 27,225 | 4,474 | 5,935 | 10,409 |
| Total | 32,038 | 33,297 | 65,335 | 36,002 | 38,344 | 74,346 | 105,004 | 110,747 | 215,751 | 79,688 | 80,174 | 159,862 |
| Average age | 36 | 38 | 37 | 37 | 39 | 38 | 36 | 39 | 38 | 30 | 32 | 31 |
| Region | Saskatchewan | Alberta | B.C. | Yukon | ||||||||
|---|---|---|---|---|---|---|---|---|---|---|---|---|
| Age group | Male | Female | Total | Male | Female | Total | Male | Female | Total | Male | Female | Total |
| 0-4 | 4,411 | 4,255 | 8,666 | 3,709 | 3,568 | 7,277 | 190 | 183 | 373 | 105 | 131 | 236 |
| 5-9 | 7,649 | 7,488 | 15,137 | 6,468 | 6,131 | 12,599 | 284 | 296 | 580 | 226 | 199 | 425 |
| 10-14 | 8,579 | 8,327 | 16,906 | 6,978 | 6,759 | 13,737 | 415 | 440 | 855 | 269 | 219 | 488 |
| 15-19 | 7,683 | 7,558 | 15,241 | 6,180 | 5,942 | 12,122 | 448 | 493 | 941 | 285 | 268 | 553 |
| 20-24 | 7,404 | 7,362 | 14,766 | 6,089 | 5,763 | 11,852 | 666 | 578 | 1,244 | 294 | 275 | 569 |
| 25-29 | 7,602 | 7,546 | 15,148 | 6,072 | 5,722 | 11,794 | 688 | 688 | 1,376 | 336 | 326 | 662 |
| 30-34 | 6,701 | 6,550 | 13,251 | 5,203 | 5,144 | 10,347 | 772 | 704 | 1,476 | 292 | 286 | 578 |
| 35-39 | 5,401 | 5,323 | 10,724 | 4,298 | 4,388 | 8,686 | 730 | 717 | 1,447 | 292 | 286 | 578 |
| 40-44 | 4,572 | 4,607 | 9,179 | 3,640 | 3,733 | 7,373 | 571 | 670 | 1,241 | 266 | 211 | 477 |
| 45-49 | 4,279 | 4,499 | 8,778 | 3,317 | 3,514 | 6,831 | 655 | 590 | 1,245 | 270 | 249 | 519 |
| 50-54 | 4,049 | 4,326 | 8,375 | 3,128 | 3,315 | 6,443 | 533 | 703 | 1,236 | 309 | 252 | 561 |
| 55-59 | 3,334 | 3,679 | 7,013 | 2,660 | 3,030 | 5,690 | 530 | 700 | 1,230 | 321 | 340 | 661 |
| 60-64 | 2,360 | 2,802 | 5,162 | 1,940 | 2,370 | 4,310 | 390 | 552 | 942 | 197 | 258 | 455 |
| 65+ | 3,731 | 5,085 | 8,816 | 3,270 | 4,767 | 8,037 | 852 | 1,523 | 2,375 | 362 | 549 | 911 |
| Total | 77,755 | 79,407 | 157,162 | 62,952 | 64,146 | 127,098 | 7,724 | 8,837 | 16,561 | 3,824 | 3,849 | 7,673 |
| Average age | 30 | 31 | 31 | 30 | 32 | 31 | 39 | 43 | 41 | 38 | 40 | 39 |
| Region | N.W.T. | Nunavut | Total | ||||||
|---|---|---|---|---|---|---|---|---|---|
| Age group | Male | Female | Total | Male | Female | Total | Male | Female | Total |
| 0-4 | 553 | 508 | 1,061 | 1,974 | 1,858 | 3,832 | 22,114 | 21,029 | 43,143 |
| 5-9 | 929 | 916 | 1,845 | 2,091 | 2,031 | 4,122 | 37,483 | 36,245 | 73,728 |
| 10-14 | 1,086 | 974 | 2,060 | 2,024 | 2,019 | 4,043 | 41,516 | 40,076 | 81,592 |
| 15-19 | 970 | 1,043 | 2,013 | 1,862 | 1,701 | 3,564 | 38,473 | 37,091 | 75,564 |
| 20-24 | 1,143 | 1,138 | 2,281 | 1,635 | 1,584 | 3,219 | 39,159 | 37,792 | 76,951 |
| 25-29 | 1,467 | 1,435 | 2,902 | 1,566 | 1,543 | 3,109 | 40,468 | 39,482 | 79,950 |
| 30-34 | 1,246 | 1,237 | 2,483 | 1,385 | 1,359 | 2,744 | 35,300 | 34,681 | 69,981 |
| 35-39 | 1,095 | 1,008 | 2,103 | 1,095 | 1,068 | 2,163 | 30,042 | 29,999 | 60,041 |
| 40-44 | 858 | 925 | 1,783 | 895 | 958 | 1,853 | 26,550 | 26,920 | 53,470 |
| 45-49 | 910 | 905 | 1,815 | 832 | 850 | 1,682 | 25,971 | 26,763 | 52,734 |
| 50-54 | 929 | 956 | 1,885 | 826 | 854 | 1,680 | 25,555 | 27,035 | 52,590 |
| 55-59 | 804 | 936 | 1,740 | 643 | 685 | 1,328 | 23,174 | 25,848 | 49,022 |
| 60-64 | 540 | 686 | 1,226 | 406 | 433 | 839 | 17,717 | 21,183 | 38,900 |
| 65+ | 1,167 | 1,452 | 2,619 | 830 | 907 | 1,737 | 33,226 | 46,626 | 79,852 |
| Total | 13,697 | 14,119 | 27,816 | 18,064 | 17,850 | 35,914 | 436,748 | 450,770 | 887,518 |
| Average age | 35 | 37 | 36 | 27 | 28 | 27 | 33 | 35 | 34 |
| Source: SVS adapted by Business Support, Audit and Negotiations Division | |||||||||
Figure 2.6: Population analysis by age group
The overall NIHB client population is relatively young compared to the general Canadian population. The share of the NIHB client population under 20 years of age was 30.9% compared to 21.6% for the Canadian population. The average age of NIHB clients is 34 compared to 41 years of age for the Canadian population.
Figure 2.6.1: Proportion of Canadian population and of the NIHB client population by age group

Source: SVS and Statistics Canada CANSIM table 051-0001, Population by Age and Sex Group, adapted by Business Support, Audit and Negotiations Division
Text alternative for Figure 2.6.1: Proportion of Canadian population and of the NIHB client population by age group
This image visually describes the proportion of the Canadian population and the NIHB eligible population by age group, as follows:
- the percentage of the Canadian population aged 0 to 9 is 10.6%
- the percentage of the NIHB population aged 0 to 9 is 13.2%
- the percentage of the Canadian population aged 10 to 19 is 11.0%
- the percentage of the NIHB population aged 10 to 19 is 17.7%
- the percentage of the Canadian population aged 20 to 29 is 13.6%
- the percentage of the NIHB population aged 20 to 29 is 17.7%
- the percentage of the Canadian population aged 30 to 39 is 13.8%
- the percentage of the NIHB population aged 30 to 39 is 14.7%
- the percentage of the Canadian population aged 40 to 49 is 12.8%
- the percentage of the NIHB population aged 40 to 49 is 12.0%
- the percentage of the Canadian population aged 50 to 59 is 14.0%
- the percentage of the NIHB population aged 50 to 59 is 11.4%
- the percentage of the Canadian population aged 60 and over is 24.2%
- the percentage of the NIHB population aged 60 and over is 13.4%
A comparison of March 2016 to March 2020 eligible client population shows an aging population. The client population 40 and above, as a proportional share of the overall client population, increased from 34.8% in 2016 to 36.8% in 2020.
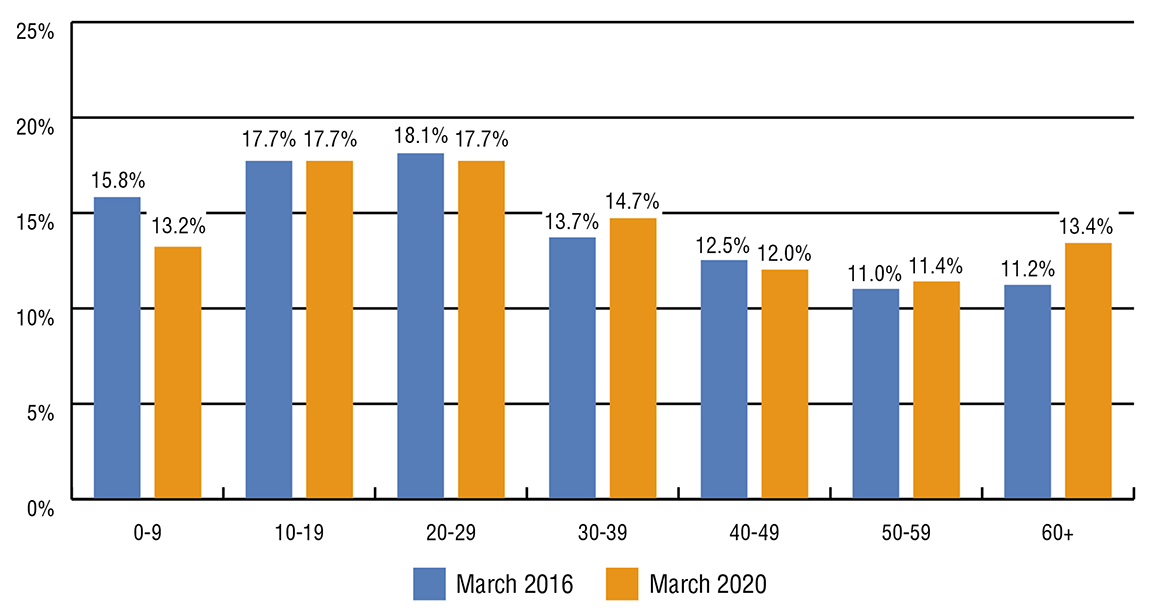
Figure 2.6.2: Proportion of eligible NIHB client population by age group
Source: SVS adapted by Business Support, Audit and Negotiations Division
Text alternative for Figure 2.6.2: Proportion of eligible NIHB client population by age group
This image visually describes the proportion of First Nations population and of Inuit population by age group as follows:
- the proportion of the First Nations and Inuit population aged 10 to 19 was 17.7% in March 2016 and 17.7% in March 2020
- the proportion of the First Nations and Inuit population aged 20 to 29 was 18.1% in March 2016 and 17.7% in March 2020
- the proportion of the First Nations and Inuit population aged 30 to 39 was 13.7% in March 2016 and 14.7% in March 2020
- the proportion of the First Nations and Inuit population aged 40 to 49 was 12.5% in March 2016 and 12.0% in March 2020
- the proportion of the First Nations and Inuit population aged 50 to 59 was 11.0% in March 2016 and 11.4% in March 2020
- the proportion of the First Nations and Inuit population aged 60 and over was 11.2% in March 2016 and 13.4% in March 2020
Section 3: NIHB program benefit expenditures
Figure 3.1: NIHB program sustainability: 2019 to 2020
Cost and service pressures on the Canadian health system have been linked to factors such as an aging population and the increased demand for and utilization of health goods, particularly pharmaceuticals, and services. In addition to these factors, NIHB program expenditures are driven by the number of eligible clients and their medical needs. The NIHB client population is growing at approximately two times the Canadian population growth rate. A significant proportion of NIHB clients live in small and remote communities, and require medical transportation to access health services that are not available locally.
Factors influencing NIHB program expenditures
Client base
- Changing demographics, including high population growth, an aging population, and uncertainty about the registration of new or existing clients
- Health status, including high prevalence of chronic and infectious diseases
- Geographic distribution of client population and accessibility of health services
Market forces
- Introduction and price of new therapies and procedures
- Provincial/Territorial decisions and insurance industry dynamics
- Shift from hospital treatments (insured) to non-insured coverage
- Economic factors, including inflation, volatility in the price of gas and oil, and employment status
- Geographic accessibility of health benefits and services
- Changes in scope of practice
- Relationships with health professional associations
Evidence/Input
- Prescribing and treatment decisions of regulated health professionals
- Evolving evidence on treatment options
- Preventive intervention versus restorative oral treatment
- Input from First Nations and Inuit partner organizations
Figure 3.2: NIHB expenditures by benefit ($ millions): 2019 to 2020
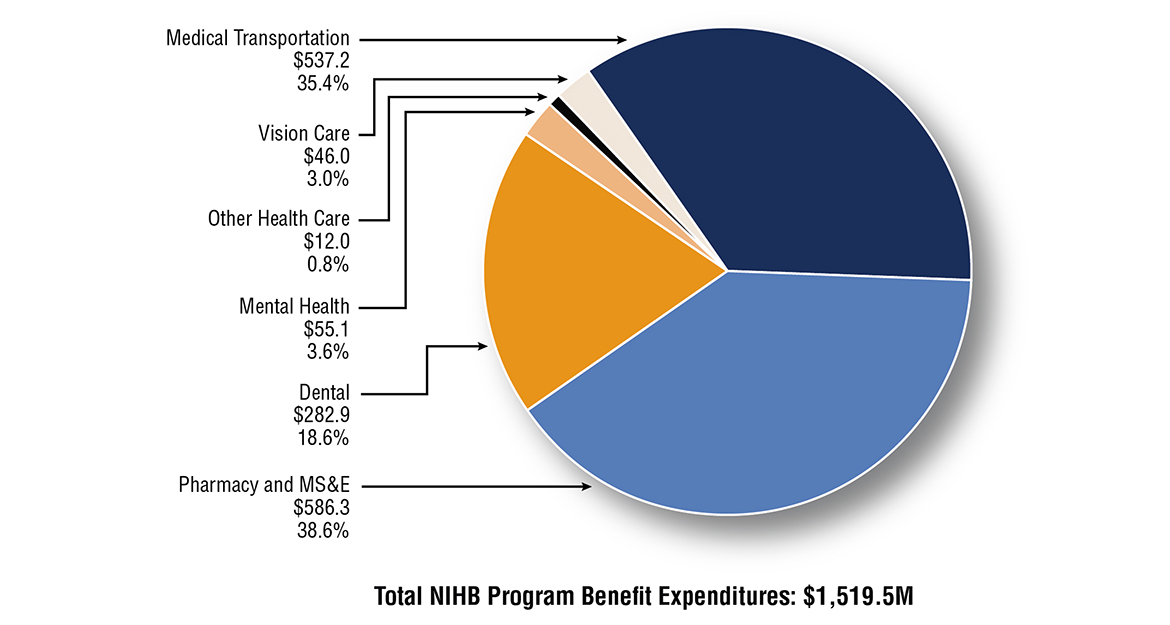
In 2019 to 2020, total NIHB program benefit expenditures were $1,519.5 million. This represents an increase of 9.3% over NIHB expenditures of $1,390.6 million in 2018/19. Of the 2019 to 2020 total, Pharmacy costs (including medical supplies and equipment) represented the largest proportion at $586.3 million (38.6%), followed by Medical Transportation costs at $537.2 million (35.4%) and Dental costs at $282.9 million (18.6%).
NIHB Pharmacy and MS&E, Dental and Medical Transportation benefit expenditures accounted for 92.6% of NIHB expenditures in 2019 to 2020.
Source: FST adapted by Business Support, Audit and Negotiations Division
Text alternative for Figure 3.2: NIHB expenditures by benefit ($ millions): 2019 to 2020
This image is a pie chart visually describing NIHB expenditures in millions and proportion of total by benefit area for fiscal year 2019 to 2020.
- total expenditures for medical transportation are $537.2 and proportion of total expenditures is 35.4%
- total expenditures for pharmacy and MS&E are $586.3 and proportion of total expenditures is 38.6%
- total expenditures for dental are $282.9 and proportion of total expenditures is 18.6%
- total expenditures for mental health care are $55.1 and proportion of total expenditures is 3.6%
- total expenditures for vision care are $46.0 and proportion of total expenditures is 3.0%
- total expenditures for other health care are $12.0 and proportion of total expenditures is 0.8%
Not reflected in the $1,519.5 million in NIHB expenditures are approximately $75.8 million in administration costs. More detail is provided in Figure 9.1.
Figure 3.3: NIHB expenditures and growth by benefit: 2019 to 2020
NIHB program benefit expenditures increased by 9.3%, or $128.9 million from fiscal year 2018 to 2019. All NIHB benefit areas had an increase in expenditures over the previous fiscal year. The highest net increase in expenditures over fiscal year 2018 to 2019 was in the NIHB Pharmacy and MS&E benefit at $50.4 million, followed by the NIHB Medical transportation benefit with an increase of $42.1 million and the NIHB Dental benefit which increased by $13.9 million. Factors affecting benefit expenditure growth are discussed in subsequent sections of this report.
| Benefit | Total expenditures ($ 000's) 2018 to 2019 | Total expenditures ($ 000's) 2019 to 2020 | % Change from 2018 to 2019 |
|---|---|---|---|
| Medical transportation | $495,034 | $537,179 | 8.5% |
| Pharmacy and MS&E | $535,949 | $586,301 | 9.4% |
| Dental | $269,008 | $282,908 | 5.2% |
| Vision care | $36,467 | $45,968 | 26.1% |
| Mental health | $42,656 | $55,126 | 29.2% |
| Other* | $11,450 | $12,001 | 4.8% |
| Total expenditures | $1,390,563 | $1,519,483 | 9.3% |
| Source: FST adapted by Business Support, Audit and Negotiations Division | |||
* Other expenditures are related to contribution agreements including funding arrangements with the FNHA for clients eligible under Bills C-3, S-3, and Qalipu clients, and for payment of health premiums for Inuit clients in British Columbia.
Figure 3.4: NIHB expenditures by benefit and region ($ 000's): 2019 to 2020
Manitoba accounted for the highest proportion of total expenditures at $352.0 million, or 23.2% of the national total, followed by Saskatchewan at $290.4 million (19.1%), and Ontario at $287.6 million (18.9%). In comparison, the lowest expenditures were in the Atlantic region at $73.1 million (4.8%).
Headquarters expenditures by benefit type represent costs paid for claims processing services. Headquarters expenditures in the 'other health care' category include funding arrangements with the FNHA for clients eligible under Bills C-3 and S-3, and Qalipu clients and for payment of health premiums for Inuit clients in British Columbia, as well as with national client stakeholder organizations (Assembly of First Nations and Inuit Tapiriit Kanatami), and regional Indigenous organizations. These expenditures account for 2.4% ($36.9 million) of NIHB expenditures, and do not include the $75.8 million in headquarters administrative costs outlined in Figure 9.1.
| Region | Medical transportation | Pharmacy | Dental | Vision care | Mental health | Other health care | Total |
|---|---|---|---|---|---|---|---|
| Atlantic | $13,910 | $39,724 | $11,545 | $4,150 | $3,428 | $314 | $73,071 |
| Quebec | $25,729 | $53,311 | $18,733 | $2,736 | $3,138 | $490 | $104,136 |
| Ontario | $106,638 | $104,760 | $55,386 | $7,860 | $12,116 | $883 | $287,643 |
| Manitoba | $168,686 | $112,025 | $52,622 | $6,935 | $11,475 | $240 | $351,983 |
| Saskatchewan | $83,947 | $126,963 | $57,639 | $9,844 | $11,783 | $210 | $290,386 |
| Alberta | $61,669 | $93,776 | $54,993 | $10,514 | $11,020 | $204 | $232,177 |
| North | $76,601 | $33,220 | $26,546 | $3,929 | $2,167 | $498 | $142,961 |
| Headquarters | $0 | $22,388 | $5,361 | $0 | $0 | $9,160 | $36,910 |
| Total | $537,179 | $586,301 | $282,908 | $45,968 | $55,126 | $12,001 | $1,519,483 |
| Source: FST adapted by Business Support, Audit and Negotiations Division | |||||||
Figure 3.5: Proportion of NIHB expenditures by region: 2019 to 2020
In 2019 to 2020, Manitoba had the highest proportion of total NIHB expenditures (23.2%) and accounted for 31.4% of total NIHB Medical Transportation expenditures. This can be attributed to the large number of First Nations clients living in remote or fly-in only northern communities in the Manitoba region.
Saskatchewan had the highest proportion of NIHB Pharmacy expenditures at 21.7%, followed by Manitoba and Ontario at 19.1% and 17.9% respectively.
Saskatchewan, which accounted for 19.1% of total NIHB expenditures in 2019 to 2020, recorded the highest proportion of total NIHB Dental expenditures at 20.4%, followed by Ontario and Alberta at 19.6% and 19.4% respectively.
The proportion of NIHB Vision Care expenditures was highest in Alberta at 22.9%, followed by 21.4% in Saskatchewan and 17.1% in Ontario.
| Region | Medical transportation | Pharmacy | Dental | Vision care | Mental health | Other health care | Proportion of NIHB expenditures | Proportion of NIHB population |
|---|---|---|---|---|---|---|---|---|
| Atlantic | 2.6% | 6.8% | 4.1% | 9.0% | 6.2% | 2.6% | 4.8% | 7.4% |
| Quebec | 4.8% | 9.1% | 6.6% | 6.0% | 5.7% | 4.1% | 6.9% | 8.4% |
| Ontario | 19.9% | 17.9% | 19.6% | 17.1% | 22.0% | 7.4% | 18.9% | 24.3% |
| Manitoba | 31.4% | 19.1% | 18.6% | 15.1% | 20.8% | 2.0% | 23.2% | 18.0% |
| Saskatchewan | 15.6% | 21.7% | 20.4% | 21.4% | 21.4% | 1.8% | 19.1% | 17.7% |
| Alberta | 11.5% | 16.0% | 19.4% | 22.9% | 20.0% | 1.7% | 15.3% | 14.3% |
| North | 14.3% | 5.7% | 9.4% | 8.5% | 3.9% | 4.2% | 9.4% | 8.0% |
| Headquarters | 0.0% | 3.8% | 1.9% | 0.0% | 0.0% | 76.3% | 2.4% | 0.0% |
| Total | 100% | 100% | 100% | 100% | 100% | 100% | 100% | 100% |
| Source: FST and SVS adapted by Business Support, Audit and Negotiations Division | ||||||||
Figure 3.6: Proportion of NIHB regional expenditures by benefit: 2019 to 2020
At the national level, three-quarters (73.9%) of total program expenditures occurred in two benefit areas: pharmacy (38.6%) and medical transportation (35.4%). Dental expenditures accounted for almost one-fifth (18.6%) of total NIHB expenditures.
Medical transportation expenditures accounted for half of benefit expenditures in the Northern region and Manitoba (53.6% and 47.9%, respectively). Conversely, in the Atlantic region only 19.0% of benefit expenditures were spent on medical transportation.
The proportion of dental expenditures ranged from 15.0% in Manitoba to 23.7% in Alberta.
In the Atlantic region, 54.4% of total expenditures were spent on pharmacy benefits. Pharmacy costs represented the highest percentage of total expenditures in all regions except in the Northern region and in Manitoba, where transportation accounted for the largest share of costs.
| Region | Medical transportation | Pharmacy | Dental | Vision care | Mental health | Other health care | Total |
|---|---|---|---|---|---|---|---|
| Atlantic | 19.0% | 54.4% | 15.8% | 5.7% | 4.7% | 0.4% | 100% |
| Quebec | 24.7% | 51.2% | 18.0% | 2.6% | 3.0% | 0.5% | 100% |
| Ontario | 37.1% | 36.4% | 19.3% | 2.7% | 4.2% | 0.3% | 100% |
| Manitoba | 47.9% | 31.8% | 15.0% | 2.0% | 3.3% | 0.1% | 100% |
| Saskatchewan | 28.9% | 43.7% | 19.8% | 3.4% | 4.1% | 0.1% | 100% |
| Alberta | 26.6% | 40.4% | 23.7% | 4.5% | 4.7% | 0.1% | 100% |
| North | 53.6% | 23.2% | 18.6% | 2.7% | 1.5% | 0.3% | 100% |
| Headquarters | 0.0% | 60.7% | 14.5% | 0.0% | 0.0% | 24.8% | 100% |
| National | 35.4% | 38.6% | 18.6% | 3.0% | 3.6% | 0.8% | 100% |
| Source: FST and SVS adapted by Business Support, Audit and Negotiations Division | |||||||
Figure 3.7: NIHB annual expenditures ($ Millions) and percentage change
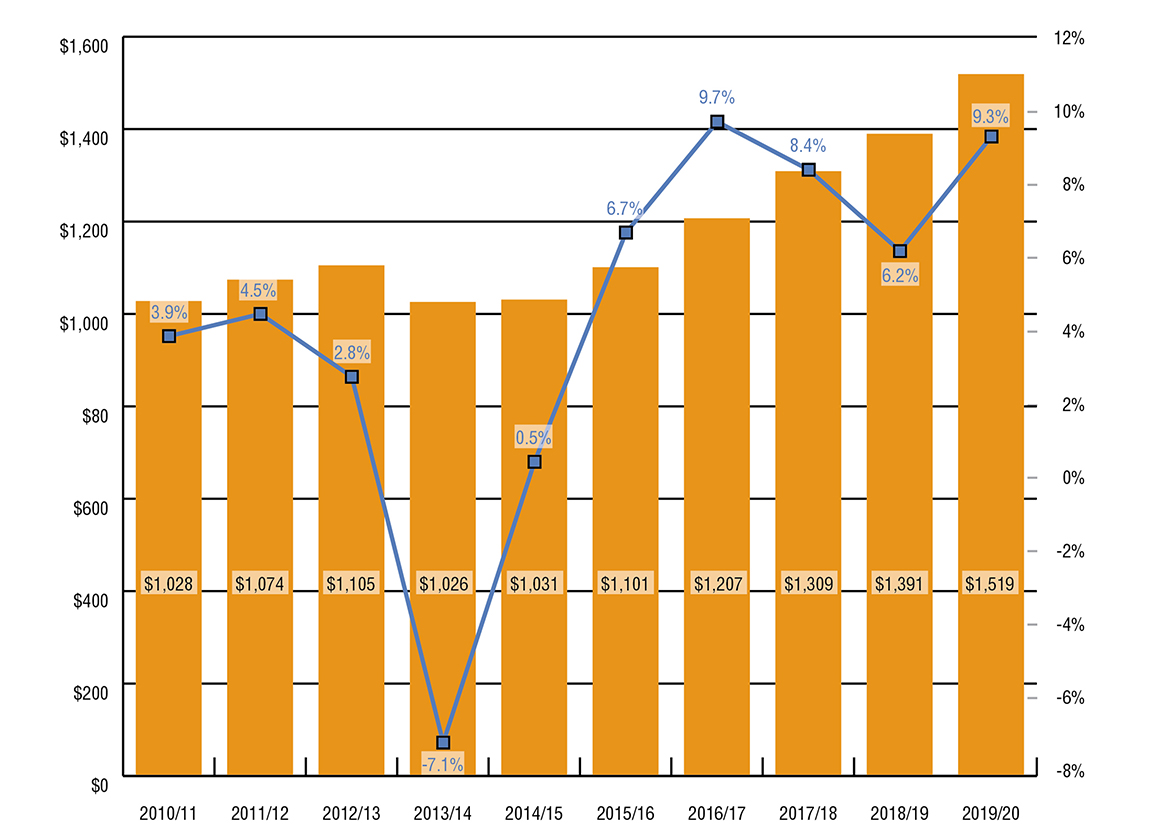
In 2019 to 2020, NIHB program expenditures totalled $1,519.5 million, an increase of 9.3% from $1,390.6 million in 2018 to 2019. Since 2010 to 2011, total expenditures have grown by 47.8%. The annualized rate of growth over this period was 4.4%. There has been wide variation in growth rates between 2010 to 2011 and 2019 to 2020, from a low of -7.1% in 2013 to 2014* to a high of 9.7 % in 2016 to 2017.
Fluctuations in NIHB expenditure growth rates are impacted by a number of factors as set out in figure 3.1. Changes in the eligible client population have a direct impact on growth. Notable examples include the transfer of responsibility for First Nations clients residing in B.C. to the FNHA in 2013 to 2014, the creation of the Qalipu Mi'kmaq band in 2011, and an increase in eligible clients as a result of amendments to the Indian Act.
If expenditures for FNHA eligible clients are excluded from 2012 to 2013 and 2013 to 2014 total NIHB expenditures, then the growth rate for 2013 to 2014 would have been 2.8%.
Source: FIRMS, FST and SVS adapted by Business Support, Audit and Negotiations Division
Text alternative for Figure 3.7: NIHB annual expenditures ($ Millions) and percentage change
This image visually describes NIHB annual expenditures in millions and annual percentage change by fiscal year, as follows:
- 2010 to 2011 is $1,028 and 3.9%
- 2011 to 2012 is $1,074 and 4.5%
- 2012 to 2013 is $1,105 and 2.8%
- 2013 to 2014 is $1,026 and -7.1%
- 2014 to 2015 is $1,031 and 0.5%
- 2015 to 2016 is $1,101 and 6.7%
- 2016 to 2017 is $1,207 and 9.7%
- 2017 to 2018 is $1,309 and 8.4%
- 2018 to 2019 is $1,391 and 6.2%
- 2019 to 2020 is $1,519 and 9.3%
Figure 3.8: NIHB annual expenditures by benefit ($ 000's)
In the period from 2010 to 2011 to 2019 to 2020, expenditures for NIHB mental health services and medical transportation benefits have grown more than other benefit areas. NIHB mental health expenditures grew by 356.2% from $12.1 million in 2010 to 2011 to $55.1 million in 2019 to 2020. NIHB medical transportation expenditures rose by 72.3% from $311.8 million in 2010 to 2011 to $537.2 million in 2019 to 2020.
Over the same period, NIHB pharmacy expenditures increased by 33.0% and NIHB dental expenditures increased by 31.1%.
The Other expenditures category includes funding arrangements with regional First Nations and Inuit organizations that employ NIHB Navigators to act as a resource for communities, organizations or individuals who need assistance or information on the NIHB program. As well, it includes funding arrangements with the First Nations Health Authority for clients eligible under Bills C-3 and S-3, Qalipu clients, and for payment of premiums for Inuit clients in British Columbia. Decreases in 'other' expenditures in 2013 to 2014 can be attributed to the transfer of responsibility for health care insurance premiums for First Nations clients residing in British Columbia to the FNHA in 2013.
| Benefit | 2010 to 2011 | 2011 to 2012 | 2012 to 2013 | 2013 to 2014 | 2014 to 2015 | 2015 to 2016 | 2016 to 2017 | 2017 to 2018 | 2018 to 2019 | 2019 to 2020 |
|---|---|---|---|---|---|---|---|---|---|---|
| Medical transportation | $311,760 | $333,304 | $351,424 | $352,036 | $357,963 | $375,904 | $417,035 | $459,505 | $495,034 | $537,179 |
| Pharmacy | $440,768 | $459,359 | $462,699 | $416,165 | $422,350 | $456,430 | $494,520 | $522,957 | $535,949 | $586,301 |
| Dental | $215,796 | $219,057 | $222,706 | $207,179 | $201,886 | $217,109 | $235,831 | $248,992 | $269,008 | $282,908 |
| Vision care | $29,219 | $29,780 | $32,167 | $31,459 | $29,704 | $30,017 | $32,370 | $33,578 | $36,467 | $45,968 |
| Mental health | $12,083 | $12,936 | $14,337 | $14,152 | $15,581 | $16,193 | $21,728 | $33,066 | $42,656 | $55,126 |
| Other | $18,428 | $19,868 | $21,257 | $5,406 | $4,005 | $4,858 | $5,974 | $11,143 | $11,450 | $12,001 |
| Total | $1,028,053 | $1,074,304 | $1,104,591 | $1,026,397 | $1,031,488 | $1,100,512 | $1,207,458 | $1,309,240 | $1,390,563 | $1,519,483 |
| Annual % change | 3.9% | 4.5% | 2.8% | -7.1% | 0.5% | 6.7% | 9.7% | 8.4% | 6.2% | 9.3% |
| Source: FIRMS and FST adapted by Business Support, Audit and Negotiations Division | ||||||||||
Figure 3.9: Per capita NIHB expenditures by region: 2019 to 2020
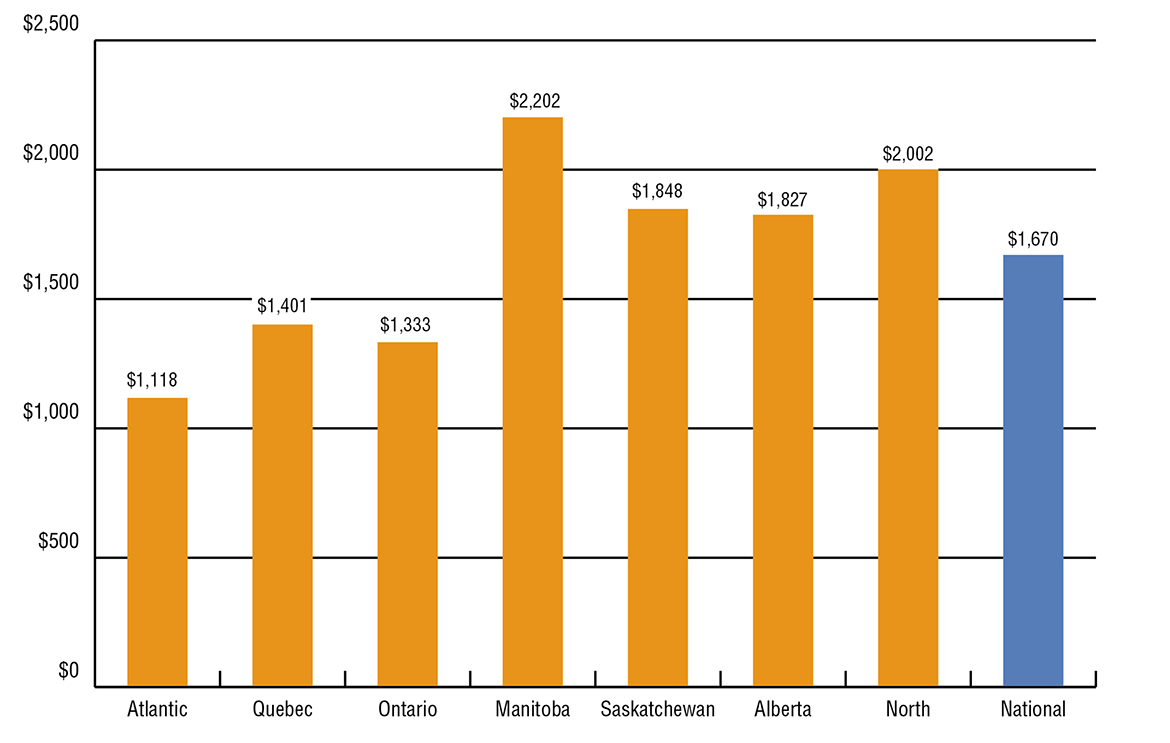
The national per capita expenditure for all benefits in 2019 to 2020 were $1670. Manitoba had the highest per capita cost at $2,202. The Northern region followed with a per capita cost of $2,002. The higher than average per capita cost for these regions is partly attributable to high medical transportation costs due to the large number of First Nations and Inuit clients living in remote or fly-in only northern communities. By contrast, the Atlantic region had the lowest per capita cost of $1,118, due to the comparatively low medical transportation expenditures in the region.
Source: FST and SVS adapted by Business Support, Audit and Negotiations Division
Text alternative for Figure 3.9: Per capita NIHB expenditures by region: 2019 to 2020
This bar graph visually describes NIHB annual expenditures in millions by fiscal year and by region. Per capita expenditure:
- for Atlantic are $1,118
- for Quebec are $1,401
- for Ontario are $1,333
- for Manitoba are $2,202
- for Saskatchewan are $1,848
- for Alberta are $1,827 and
- for the North are $2,002
- national per capita expenditures are $1,670
Section 4: NIHB pharmacy expenditure and utilization data
The NIHB program covers a comprehensive range of prescription drugs and over-the-counter medications listed on the NIHB Drug Benefit List (DBL). In addition, a range of medical supplies and equipment (MS&E) items are covered by the program. Prescription and over-the-counter medications, as well as MS&E benefits, are evidence-based and covered in accordance with program policies. Items covered through the MS&E benefit are intended to address NIHB clients' medical needs in relation to basic activities of daily living (ADL) such as eating, bathing, dressing, toileting and transferring, and include:
- pressure garments
- medical supplies, such as dressings and bandages
- medical equipment, such as wheelchairs and walkers
- orthotics and custom footwear
- prosthetics, such as artificial limbs
- oxygen supplies and equipment and
- respiratory supplies and equipment
- audiology benefits, such as hearing aids and their repair
In 2019 to 2020, the NIHB program paid for pharmacy and MS&E claims made by a total of 545,199 First Nations and Inuit clients. The total expenditure for these claims was $586.3 million or 38.6% of total NIHB expenditures. Of all the NIHB program benefits, the pharmacy benefit accounts for the largest share of expenditures and is the benefit most utilized by clients.
Figure 4.1: Distribution of NIHB pharmacy and MS&E expenditures ($ Millions): 2019 to 2020
Figure 4.1 illustrates the components of pharmacy and MS&E expenditures under the NIHB program. The cost of prescription drugs paid through the Health Information and Claims Processing Services (HICPS) system was the largest component, accounting for $414.6 million or 70.7% of all NIHB pharmacy expenditures, followed by over-the-counter (OTC) drugs and controlled access drugs (CAD)which totalled $85.0 million or 14.5%. Medical supplies and equipment (MS&E) items paid through HICPS was the third largest component in the pharmacy benefit at $52.0 million or 8.9%.
Drugs and MS&E (regional), at $2.2 million or 0.4% of pharmacy and MS&E benefit costs, refers to prescription drugs, OTC medications and MS&E items paid through Indigenous Services Canada regional offices.
Contribution agreements, which accounted for $10.1 million or 1.7% of total pharmacy and MS&E benefit costs, are used to fund the provision of pharmacy benefits through agreements such as those with the Mohawk Council of Akwesasne in Ontario and the Bigstone Cree Nation in Alberta.
Other costs totalled $22.4 million or 3.8% in 2019 to 2020. Included in this total are headquarters contract and claims processing expenditures related to the HICPS system.

Source: FST adapted by Business Support, Audit and Negotiations Division
Text alternative for Figure 4.1: Distribution of NIHB pharmacy and MS&E expenditures ($ Millions): 2019 to 2020
This image is a pie chart which visually describes NIHB pharmacy expenditure in millions and proportion of total expenditure by component type:
- prescription drugs (HICPS) are $414.6 and 70.7%
- OTC/CAD drugs (HICPS) are $85.0 and 14.5%
- other costs are $22.4 and 3.8%
- contribution agreements are $10.1 and 1.7%
- drugs and MS&E (regional) are $2.2 and 0.4%
- MS&E (HICPS) are $52.0 and 8.9%
- total expenditures $586.3
Figure 4.2: Total NIHB pharmacy and MS&E expenditures by type and region ($ 000's): 2019 to 2020
Prescription drug costs paid through the HICPS system represented the largest component of total NIHB pharmacy costs accounting for $414.6 million or 70.7%. The Saskatchewan region had the largest proportion of these costs at 23.3%, followed by Manitoba at 19.4% and Ontario at 19.0%.
The next highest component was over-the-counter (OTC) and controlled access drug (CAD) costs at $85.0 million or 14.5%. The regions of Manitoba (23.0%), Saskatchewan (19.9%) and Ontario (18.8%) had the largest proportions of these costs in 2019 to 2020.
The third highest component was the combined medical supplies and equipment (MS&E) category at $52.0 million (8.9%). Saskatchewan (22.7%) had the highest proportion of MS&E costs in 2019/20, followed by Manitoba (22.4%) and Alberta (19.7%).
| Region | Operating | Total operating costs | Total contribution costs | Total costs | |||||
|---|---|---|---|---|---|---|---|---|---|
| Prescription drugs | OTC/CAD drugs | Drugs/MS&E regional | Medical supplies | Medical equipment | Other costs | ||||
| Atlantic | $28,846 | $6,518 | $10 | $1,171 | $3,178 | $0 | $39,724 | $0 | $39,724 |
| Quebec | $41,244 | $9,499 | $4 | $805 | $1,759 | $0 | $53,311 | $0 | $53,311 |
| Ontario | $78,794 | $15,950 | $40 | $1,752 | $5,002 | $0 | $101,538 | $3,222 | $104,760 |
| Manitoba | $80,502 | $19,555 | $320 | $3,089 | $8,559 | $0 | $112,025 | $0 | $112,025 |
| Saskatchewan | $96,735 | $16,937 | $1,442 | $3,450 | $8,356 | $0 | $126,921 | $42 | $126,963 |
| Alberta | $64,343 | $12,529 | $16 | $2,820 | $7,413 | $0 | $87,121 | $6,655 | $93,776 |
| North | $24,022 | $3,954 | $361 | $1,313 | $3,365 | $0 | $33,015 | $205 | $33,220 |
| Headquarters | $0 | $0 | $0 | $0 | -$12 | $22,388 | $22,376 | $0 | $22,376 |
| Total | $414,621 | $84,953 | $2,193 | $14,401 | $37,621 | $22,389 | $576,177 | $10,124 | $586,301 |
| Source: FST adapted by Business Support, Audit and Negotiations Division | |||||||||
Figure 4.3: Annual NIHB pharmacy expenditures
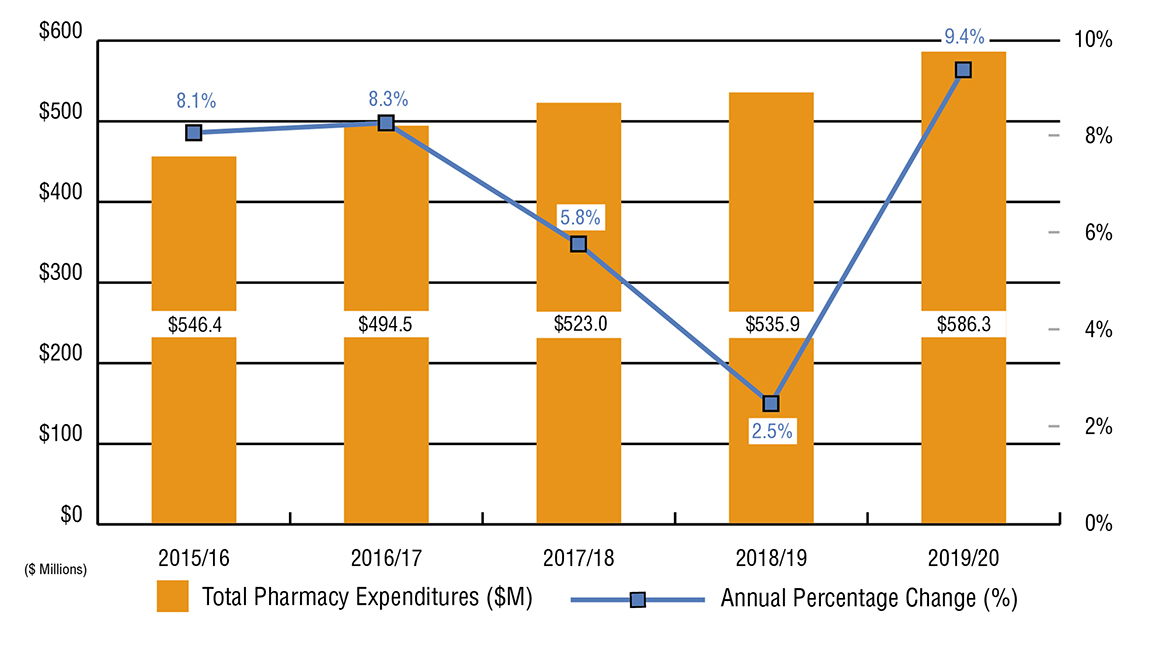
NIHB pharmacy expenditures increased by 9.4% during fiscal year 2019 to 2020. Over the past five years, growth in pharmacy expenditures has ranged from a high of 9.4% in 2019 to 2020 to a low of 2.5% in 2018 to 2019.
The 5 year annualized growth rate for NIHB pharmacy expenditures is 4.9%. The introduction of lower cost generic drugs as they become available on the market, optimized drug utilization, and changes in generic pricing policies in key provinces have kept pharmacy benefit growth moderate. As well, NIHB has negotiated Product Listing Agreements (PLA) with drug manufacturers to allow for the coverage of certain medications at a reduced price through the use of rebates, medications which would otherwise not be considered cost-effective or affordable. NIHB currently has more than 150 PLA in effect.
Figure 4.3.1: Annual NIHB pharmacy expenditures and percentage change
Source: FST and FIRMS adapted by Business Support, Audit and Negotiations Division
Text alternative for Figure 4.3.1: Annual NIHB pharmacy expenditures and percentage change
This image visually describes NIHB annual pharmacy expenditures in millions and percentage change by fiscal year, as follows:
- 2015 to 2016 are $456.4 and 8.1%
- 2016 to 2017 are $494.5 and 8.3%
- 2017 to 2018 are $523.0 and 5.8%
- 2018 to 2019 are $535.9 and 2.5%
- 2019 to 2020 are $586.3 and 9.4%
Figure 4.3.2: NIHB pharmacy expenditures ($ 000's) by region
| Region | 2015 to 2016 | 2016 to 2017 | 2017 to 2018 | 2018 to 2019 | 2019 to 2020 |
|---|---|---|---|---|---|
| Atlantic | $30,064 | $31,899 | $33,021 | $34,348 | $39,724 |
| Quebec | $44,206 | $47,444 | $48,390 | $48,967 | $53,311 |
| Ontario | $88,872 | $94,101 | $99,550 | $100,558 | $104,760 |
| Manitoba | $87,997 | $94,757 | $98,046 | $101,250 | $112,025 |
| Saskatchewan | $91,170 | $104,082 | $119,326 | $118,250 | $126,963 |
| Alberta | $69,992 | $77,265 | $79,343 | $83,103 | $93,776 |
| North | $27,408 | $28,488 | $29,373 | $31,571 | $33,220 |
| Headquarters | $16,546 | $16,302 | $15,816 | $17,817 | $22,376 |
| Total | $456,430 | $494,520 | $522,957 | $535,949 | $586,301 |
| Source: FST and FIRMS adapted by Business Support, Audit and Negotiations Division | |||||
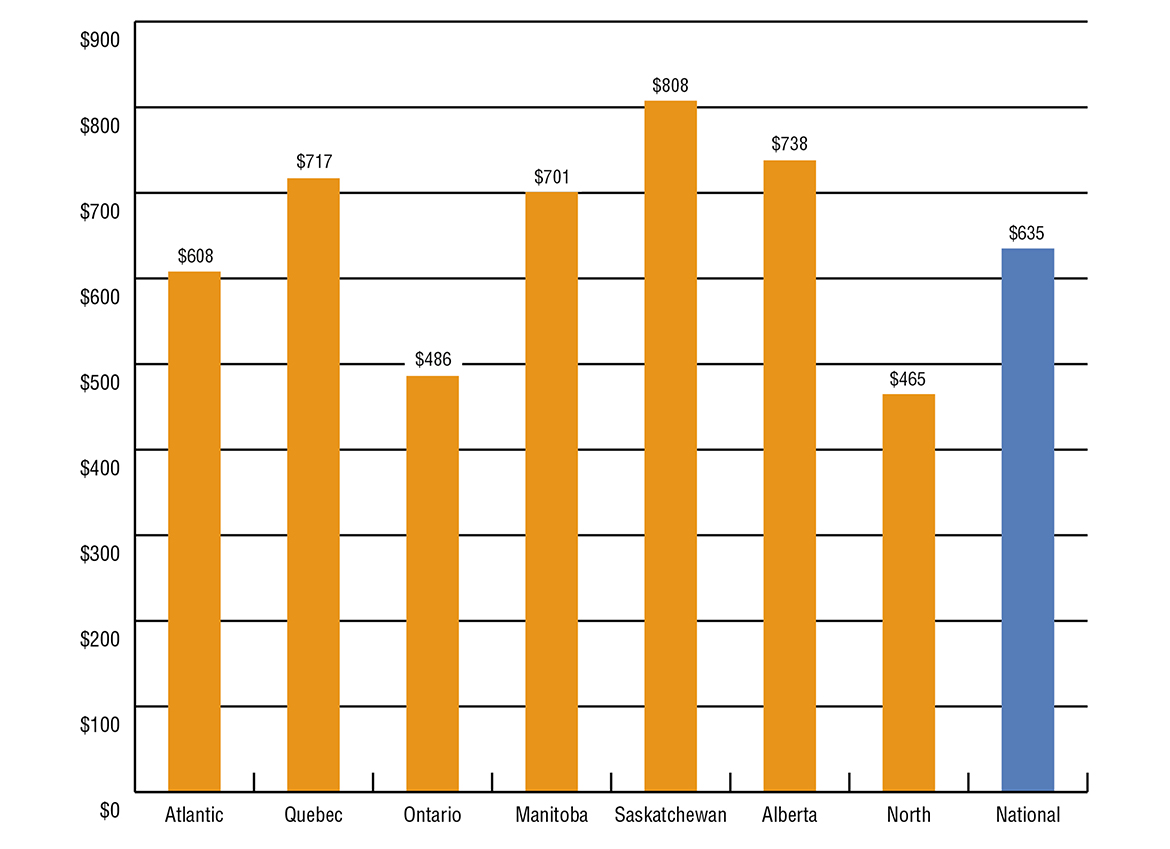
Figure 4.4: Per capita NIHB pharmacy expenditures by region: 2019 to 2020
In 2019 to 2020, the national per capita expenditure for NIHB Pharmacy benefits was $635. This was an increase of 7.1% from the $593 recorded in 2018 to 2019.
Saskatchewan had the highest per capita NIHB pharmacy expenditures at $808, followed by Quebec at $717.
The Northern region had the lowest per capita expenditures at $465 followed by Ontario at $486. Relatively low per capita expenditures in the North are attributed to lower than average utilization rates and also a younger population utilizing lower cost medications. (Refer to Figure 4.6)
Source: FST and SVS adapted by Business Support, Audit and Negotiations Division
Text alternative for Figure 4.4: Per capita NIHB pharmacy expenditures by region: 2019 to 2020
This image visually describes NIHB pharmacy expenditures per capita by region, as follows:
- Atlantic has $608
- Quebec has $717
- Ontario has $486
- Manitoba has $701
- Saskatchewan has $808
- Alberta has $738
- North has $465 and
- National has $635
Figure 4.5: NIHB pharmacy operating expenditures per claimant by region: 2019 to 2020
Expenditures per claimant are based on the total cost of pharmacy claims processed through the HICPS system, divided by the number of clients who submitted at least one pharmacy claim.
In 2019 to 2020, the national average per claimant expenditures were $1,012, an increase of 9.3% over 2018 to 2019.
Quebec had the highest average NIHB Pharmacy operating expenditure per claimant at $1,163, followed by Saskatchewan at $1,139.

Source: HICPS and SVS adapted by Business Support, Audit and Negotiations Division
Text alternative for Figure 4.5: NIHB pharmacy operating expenditures per claimant by region: 2019 to 2020
This image visually describes NIHB annual pharmacy expenditures per claimant by region, as follows:
- Atlantic has $961
- Quebec has $1,163
- Ontario has $902
- Manitoba has $1,034
- Saskatchewan has $1,139
- Alberta has $1,029
- North has $866
- National has $1,012
Figure 4.6: NIHB pharmacy utilization rates by region
Utilization rates represent the number of clients who received at least one pharmacy benefit paid through the HICPS system in the fiscal year, as a proportion of the total number of eligible clients.
In 2019 to 2020, the national utilization rate was 61% for NIHB Pharmacy benefits paid through the HICPS system.
The rates understate the actual level of utilization as the data do not include pharmacy services provided through contribution agreements and benefits provided through community health facilities or provided completely via alternate health coverage. For example, if the Bigstone Cree Nation client population were removed from the Alberta region's population because the HICPS system does not capture any data on services used by this population, the utilization rate for pharmacy benefits in Alberta would have been 71.2% in 2019 to 2020. Similarly for the Ontario region, if the Akwesasne client population were removed from the Ontario region's population, the utilization rate for pharmacy benefits would have been 55.5%. If both the Bigstone and Akwesasne client populations were removed from the overall NIHB population, the national utilization rate for pharmacy benefits would have been 63%.
| Region | Pharmacy utilization | ||||
|---|---|---|---|---|---|
| 2015 to 2016 | 2016 to 2017 | 2017 to 2018 | 2018 to 2019 | 2019 to 2020 | |
| Atlantic | 62% | 63% | 63% | 68% | 63% |
| Quebec | 60% | 60% | 61% | 63% | 62% |
| Ontario | 54% | 54% | 53% | 49% | 52% |
| Manitoba | 67% | 67% | 67% | 69% | 68% |
| Saskatchewan | 70% | 70% | 69% | 72% | 70% |
| Alberta | 66% | 66% | 65% | 67% | 67% |
| Yukon | 60% | 60% | 60% | 60% | 60% |
| Northwest Territories | 54% | 55% | 55% | 57% | 55% |
| Nunavut | 46% | 47% | 50% | 52% | 49% |
| National | 61% | 61% | 61% | 62% | 61% |
| Source: HICPS and SVS adapted by Business Support, Audit and Negotiations Division | |||||
Figure 4.7: NIHB pharmacy claimants by age group, gender and region: 2019 to 2020
Of the 887,518 clients eligible to receive benefits under the NIHB program, a total of 545,199 claimants, representing 61% of the NIHB client population, received at least one pharmacy item paid through the Health Information and Claims Processing Services (HICPS) system in 2019 to 2020. Of this total, 308,325 were female (57%) and 236,874 were male (43%). This compares to the total eligible population where 51% were female and 49% were male.
The average age of pharmacy claimants was 35 years. The average age for female and male claimants was 35 and 34 years of age, respectively.
| Region | Atlantic | Quebec | Ontario | Manitoba | ||||||||
|---|---|---|---|---|---|---|---|---|---|---|---|---|
| Age group | Male | Female | Total | Male | Female | Total | Male | Female | Total | Male | Female | Total |
| 0-4 | 1,002 | 956 | 1,958 | 1,231 | 1,161 | 2,392 | 1,983 | 1,817 | 3,800 | 3,837 | 3,711 | 7,548 |
| 5-9 | 1,137 | 1,207 | 2,344 | 1,328 | 1,406 | 2,734 | 2,576 | 2,646 | 5,222 | 4,559 | 4,703 | 9,262 |
| 10-14 | 1,159 | 1,260 | 2,419 | 1,329 | 1,480 | 2,809 | 2,625 | 2,913 | 5,538 | 4,221 | 4,625 | 8,846 |
| 15-19 | 1,179 | 1,748 | 2,927 | 1,196 | 1,873 | 3,069 | 2,919 | 4,544 | 7,463 | 3,691 | 5,341 | 9,032 |
| 20-24 | 1,230 | 2,067 | 3,297 | 1,215 | 2,067 | 3,282 | 3,194 | 5,426 | 8,620 | 3,747 | 5,827 | 9,574 |
| 25-29 | 1,297 | 2,007 | 3,304 | 1,390 | 2,237 | 3,627 | 3,880 | 6,001 | 9,881 | 4,054 | 5,985 | 10,039 |
| 30-34 | 1,168 | 1,635 | 2,803 | 1,175 | 1,941 | 3,116 | 3,653 | 5,153 | 8,806 | 3,594 | 4,858 | 8,452 |
| 35-39 | 1,138 | 1,608 | 2,746 | 1,231 | 1,642 | 2,873 | 3,459 | 4,801 | 8,260 | 3,218 | 4,053 | 7,271 |
| 40-44 | 1,174 | 1,493 | 2,667 | 1,202 | 1,595 | 2,797 | 3,429 | 4,423 | 7,852 | 3,071 | 3,779 | 6,850 |
| 45-49 | 1,411 | 1,629 | 3,040 | 1,344 | 1,705 | 3,049 | 3,709 | 4,651 | 8,360 | 3,152 | 3,984 | 7,136 |
| 50-54 | 1,431 | 1,752 | 3,183 | 1,448 | 1,925 | 3,373 | 3,988 | 4,912 | 8,900 | 3,127 | 3,640 | 6,767 |
| 55-59 | 1,313 | 1,649 | 2,962 | 1,574 | 1,901 | 3,475 | 3,950 | 5,013 | 8,963 | 2,796 | 3,243 | 6,039 |
| 60-64 | 1,213 | 1,504 | 2,717 | 1,332 | 1,781 | 3,113 | 3,289 | 4,235 | 7,524 | 1,942 | 2,450 | 4,392 |
| 65+ | 2,136 | 2,842 | 4,978 | 2,492 | 3,654 | 6,146 | 5,349 | 8,022 | 13,371 | 2,850 | 3,993 | 6,843 |
| Total | 17,988 | 23,357 | 41,345 | 19,487 | 26,368 | 45,855 | 48,003 | 64,557 | 112,560 | 47,859 | 60,192 | 108,051 |
| Average age | 38 | 39 | 38 | 38 | 39 | 39 | 39 | 40 | 40 | 32 | 33 | 32 |
| Region | Saskatchewan | Alberta | North | Total | ||||||||
|---|---|---|---|---|---|---|---|---|---|---|---|---|
| Age group | Male | Female | Total | Male | Female | Total | Male | Female | Total | Male | Female | Total |
| 0-4 | 4,025 | 3,929 | 7,954 | 3,263 | 3,102 | 6,365 | 1,391 | 1,255 | 2,646 | 16,791 | 15,999 | 32,790 |
| 5-9 | 4,716 | 5,076 | 9,792 | 3,956 | 3,849 | 7,805 | 1,166 | 1,216 | 2,382 | 19,540 | 20,212 | 39,752 |
| 10-14 | 4,531 | 5,005 | 9,536 | 3,488 | 3,820 | 7,308 | 1,025 | 1,149 | 2,174 | 18,498 | 20,394 | 38,892 |
| 15-19 | 3,927 | 5,804 | 9,731 | 3,225 | 4,207 | 7,432 | 988 | 1,916 | 2,904 | 17,259 | 25,657 | 42,916 |
| 20-24 | 3,796 | 6,186 | 9,982 | 3,227 | 4,458 | 7,685 | 1,127 | 2,130 | 3,257 | 17,673 | 28,413 | 46,086 |
| 25-29 | 4,282 | 6,192 | 10,474 | 3,311 | 4,486 | 7,797 | 1,210 | 2,261 | 3,471 | 19,593 | 29,494 | 49,087 |
| 30-34 | 3,839 | 5,378 | 9,217 | 2,956 | 3,822 | 6,778 | 1,114 | 1,903 | 3,017 | 17,681 | 24,998 | 42,679 |
| 35-39 | 3,231 | 4,271 | 7,502 | 2,623 | 3,421 | 6,044 | 1,013 | 1,653 | 2,666 | 16,086 | 21,713 | 37,799 |
| 40-44 | 3,011 | 3,848 | 6,859 | 2,378 | 2,817 | 5,195 | 958 | 1,355 | 2,313 | 15,362 | 19,554 | 34,916 |
| 45-49 | 3,077 | 3,795 | 6,872 | 2,229 | 2,836 | 5,065 | 1,126 | 1,477 | 2,603 | 16,225 | 20,320 | 36,545 |
| 50-54 | 2,888 | 3,585 | 6,473 | 2,168 | 2,535 | 4,703 | 1,126 | 1,498 | 2,624 | 16,328 | 20,134 | 36,462 |
| 55-59 | 2,430 | 3,047 | 5,477 | 1,855 | 2,376 | 4,231 | 1,013 | 1,391 | 2,404 | 15,076 | 18,832 | 33,908 |
| 60-64 | 1,762 | 2,258 | 4,020 | 1,332 | 1,790 | 3,122 | 713 | 1,013 | 1,726 | 11,660 | 15,161 | 26,821 |
| 65+ | 2,609 | 3,661 | 6,270 | 2,057 | 3,054 | 5,111 | 1,508 | 1,994 | 3,502 | 19,102 | 27,444 | 46,546 |
| Total | 48,124 | 62,035 | 110,159 | 38,068 | 46,573 | 84,641 | 15,478 | 22,211 | 37,689 | 236,874 | 308,325 | 545,199 |
| Average age | 31 | 32 | 31 | 30 | 32 | 31 | 35 | 36 | 35 | 34 | 35 | 35 |
| Source: HICPS and SVS adapted by Business Support, Audit and Negotiations Division | ||||||||||||
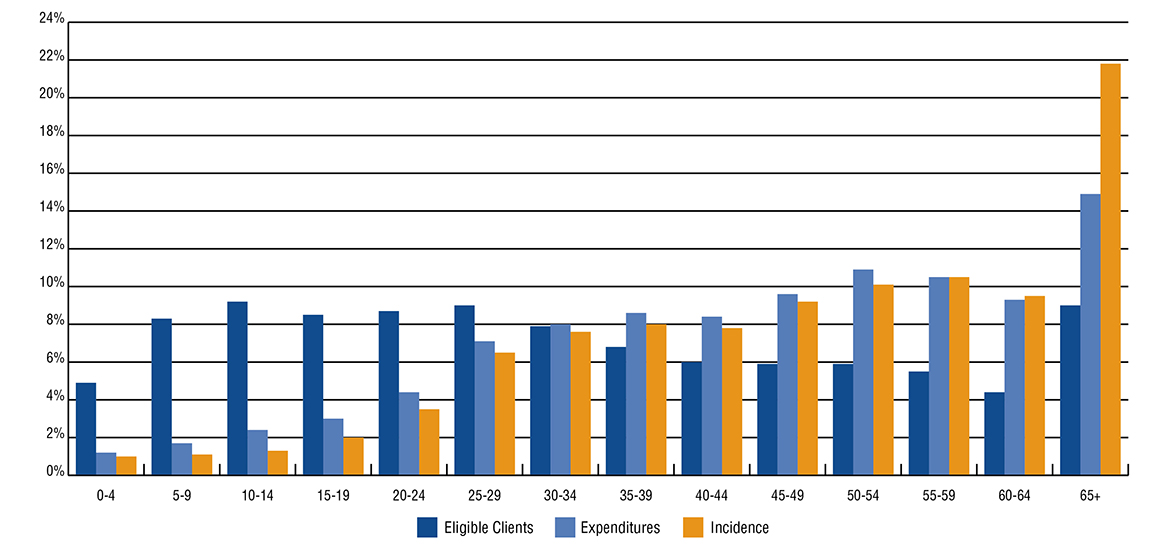
Figure 4.8: Distribution of eligible NIHB population, pharmacy expenditures and pharmacy incidence by age group: 2019 to 2020
The main drivers of NIHB pharmacy expenditures are the cost of medications, and supplies and equipment, the volume of claims submitted and the professional fees associated with filling these claims. In 2019 to 2020, 4.9% of all clients were in the 0 to 4 age group, but this group accounted for only 1.0% of all pharmacy claims made and only 1.2% of total pharmacy expenditures. In contrast, 9.0% of all eligible clients were in the 65+ age group, but accounted for 21.8 % of all pharmacy claims submitted and 14.9% of total pharmacy expenditures.
During 2019 to 2020, the average claimant aged 65 or more submitted 95 claims compared to 72 claims for their counterpart in the 60 to 64 age group and 6 claims for the average claimant in the 0 to 4 age group.
Source: HICPS, FST and SVS adapted by Business Support, Audit and Negotiations Division
Text alternative for Figure 4.8: Distribution of eligible NIHB population, pharmacy expenditures and pharmacy incidence by age group: 2019 to 2020
This image visually describes NIHB annual pharmacy expenditures and incidence by age group, as follows:
| Age | Eligible clients | Incidence | Expenditures |
|---|---|---|---|
| 0–4 | 4.9% | 1.0% | 1.2% |
| 5–9 | 8.3% | 1.1% | 1.7% |
| 10–14 | 9.2% | 1.3% | 2.4% |
| 15–19 | 8.5% | 2.0% | 3.0% |
| 20–24 | 8.7% | 3.5% | 4.4% |
| 25–29 | 9.0% | 6.5% | 7.1% |
| 30–34 | 7.9% | 7.6% | 8.0% |
| 35–39 | 6.8% | 8.0% | 8.6% |
| 40–44 | 6.0% | 7.8% | 8.4% |
| 45–49 | 5.9% | 9.2% | 9.6% |
| 50–54 | 5.9% | 10.1% | 10.9% |
| 55–59 | 5.5% | 10.5% | 10.5% |
| 60–64 | 4.4% | 9.5% | 9.3% |
| 65+ | 9.0% | 21.8% | 14.9% |
| Total | 100.0% | 100.0% | 100.0% |
An examination of pharmacy benefit cost per NIHB claimant indicates that these expenditures vary according to age. For example, in 2019 to 2020 the average cost per child aged 0 to 4 years was $199. The cost increased steadily for every age group, with claimants aged 30-34 having an average cost of $1,032, comparable to the total average claimant cost of $1,012. Claimants aged 60-64 years had the highest cost per claimant with an average of $1,904 for all pharmaceutical services received throughout the fiscal year.
Figure 4.9: NIHB top 10 therapeutic classes by number of claimants: 2019 to 2020
Figure 4.9 ranks the top ten therapeutic classes according to number of claimants. In 2019 to 2020, Non-Steroidal Anti-Inflammatory Drugs (NSAID) had the highest number of distinct claimants at 205,048, an increase of 1.4% over 2018 to 2019. Penicillins such as Amoxil (Amoxicillin) ranked second in number of claimants with 163,239 followed by Miscellaneous Analgesics and Antipyretics with 144,246 claimants.
| Therapeutic classification | Claimants | % Change from 2018 to 2019 | Examples of product in the therapeutic class |
|---|---|---|---|
| Non-Steroidal Anti-Inflammatory Drugs (NSAID) | 205,048 | 1.4% | Voltaren (Diclofenac) |
| Penicillins | 163,239 | 7.4% | Amoxil (Amoxicillin) |
| Miscellaneous Analgesics and Antipyretics | 144,246 | 12.2% | Tylenol (Acetaminophen) |
| Antidepressants | 104,758 | 6.2% | Effexor (Venlafaxine) |
| Opioid Agonists | 104,274 | -3.6% | Statex (Morphine Sulphate) |
| Proton Pump Inhibitors | 102,410 | 11.0% | Losec (Omeprazole) |
| Beta-Adrenergic Agonists | 93,893 | 11.0% | Ventolin (Salbutamol) |
| Adrenals | 75,730 | 11.8% | Flovent (Fluticasone Propionate) |
| Cephalosporins | 75,146 | 3.7% | Keflex (Cephalexin) |
| HMG-COA Reductase Inhibitors (Statins) | 72,049 | 6.4% | Lipitor (Atorvastatin) |
| Source: HICPS adapted by Business Support, Audit and Negotiations Division | |||
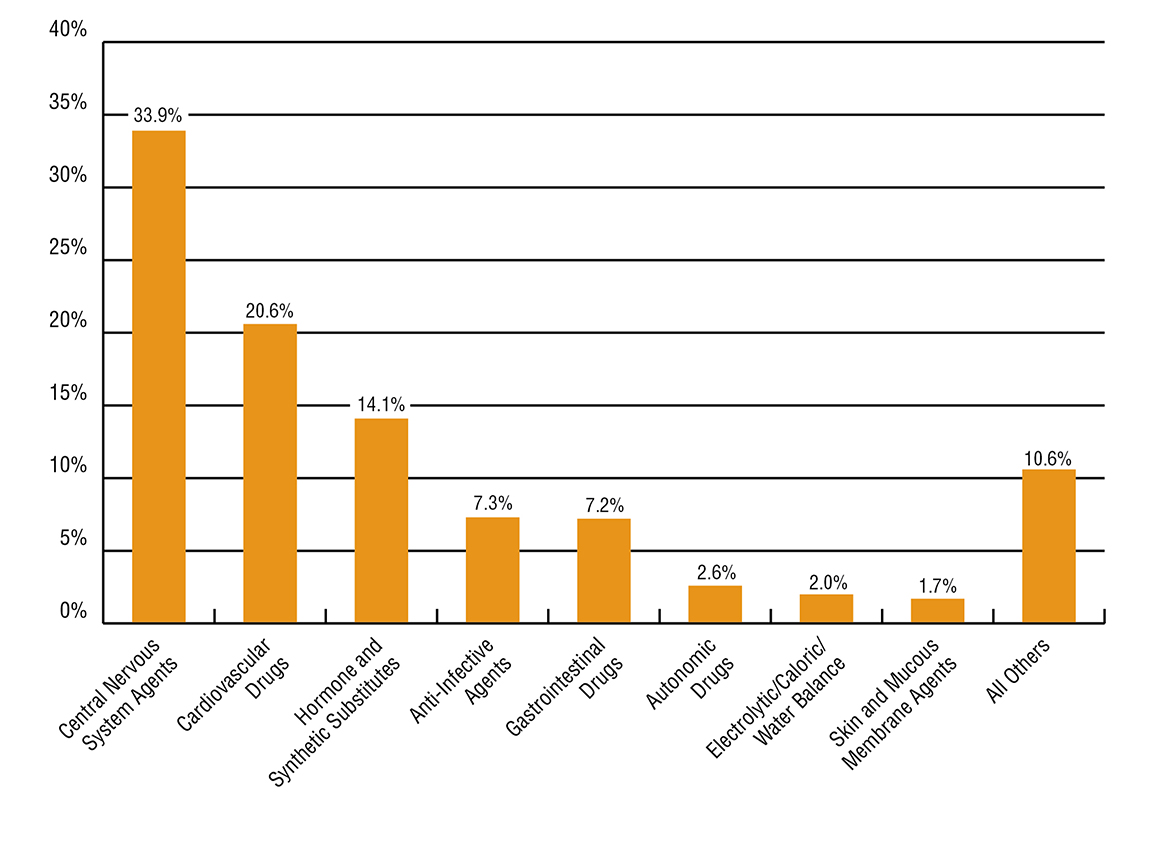
Figure 4.10: NIHB prescription drug claims incidence by therapeutic class: 2019 to 2020
Figure 4.10 looks at the number of claims by therapeutic classification for prescription drugs.
Central nervous system agents, which include drug classes such as analgesics and sedatives, accounted for 33.9% of all prescription drug claims in 2019 to 2020. Central nervous systems agents are used in the treatment of diverse health conditions such as arthritis, depression or epilepsy.
Cardiovascular drugs had the next highest share of prescription drug claims at 20.6% followed by hormones and synthetic substitutes, which consist primarily of oral contraceptives and insulin, at 14.1%. Cardiovascular drugs are used to treat clients with arrhythmias, hypercholesterolemia or ischemic heart disease. Hormones and synthetic substitutes are given to clients to treat conditions such as diabetes or hypothyroidism.
Source: HICPS adapted by Business Support, Audit and Negotiations Division
Text alternative for Figure 4.10: NIHB prescription drug claims incidence by therapeutic class: 2019 to 2020
This bar graph visually describes percentage of NIHB prescription drug claims by therapeutic class, as follows:
- central nervous system agents, 33.9%
- cardiovascular drugs, 20.6%
- hormones and synthetic substitutes, 14.1%
- anti-infective agents, 7.3%
- gastrointestinal drugs, 7.2%
- autonomic drugs, 2.6%
- electrolytic/caloric/water balance, 2.0%
- skin and mucous membrane agents, 1.7%
- all others, 10.6%
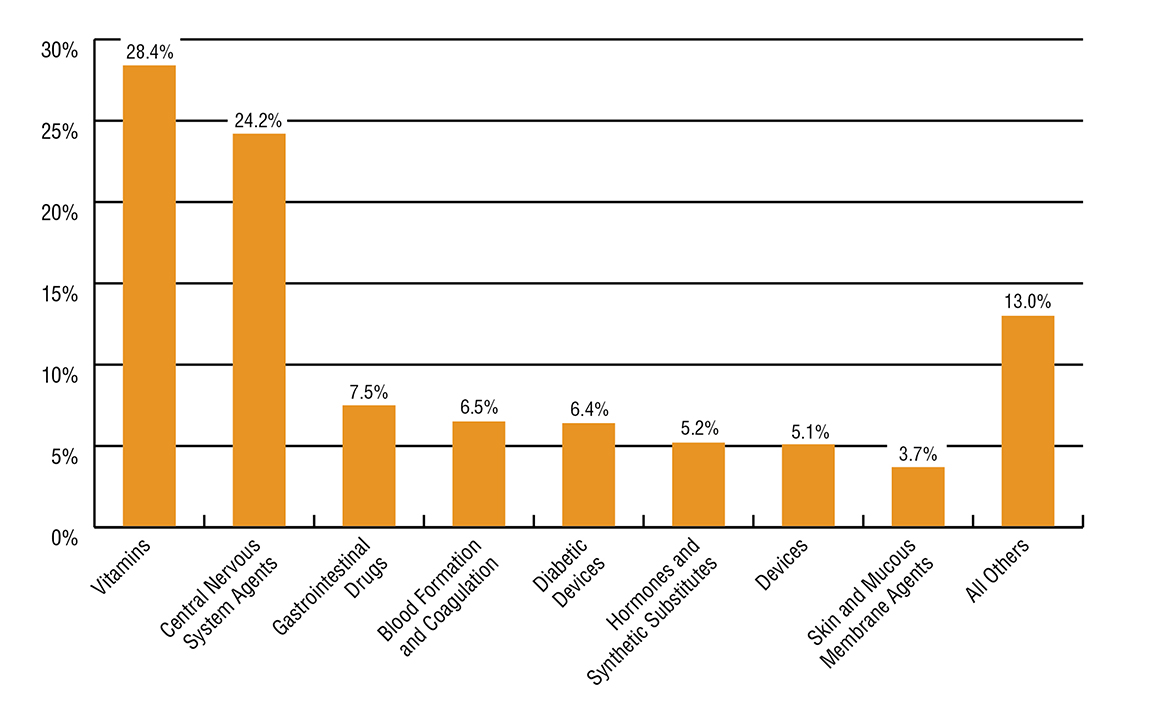
Figure 4.11: NIHB over-the-counter drugs (including controlled access drugs — CAD) claims incidence by therapeutic class: 2019 to 2020
Figure 4.11 shows the variation in claims incidence by therapeutic classification for over-the-counter (OTC) drugs. The NIHB program covers the cost of some OTC drugs. To be reimbursed by the NIHB program, all OTC drugs require a prescription from a recognized health professional with the authority to prescribe in their province or territory of practice.
Vitamins were the highest category of OTC medications in 2019 to 2020 accounting for 28.4% of all OTC drug claims. OTC central nervous system agents, which are drugs, like acetaminophen, that are used to manage pain such as headaches, followed at 24.2% of all OTC drug claims, and gastrointestinal products such as antacids and laxatives, which are used to treat heartburn and constipation, followed at 7.5%.
Source: HICPS adapted by Business Support, Audit and Negotiations Division
Text alternative for Figure 4.11: NIHB over-the-counter drugs (including controlled access drugs — CAD) claims incidence by therapeutic class: 2019 to 2020
This bar graph visually describes percentage of NIHB OTC drug claims by therapeutic class, as follows:
- vitamins is 28.4%
- central nervous system agents is 24.2%
- gastrointestinal drugs is 7.5%
- blood formation and coagulation is 6.5%
- diabetic devices is 6.4%
- hormones and synthetic substitutes is 5.2%
- devices is 5.1%
- skin and mucous membrane agents is 3.7%
- all others is 13.0%
Figure 4.12: NIHB medical supplies by category and claims incidence: 2019 to 2020
Figure 4.12 shows the variation in medical supply claims incidence by category.
In 2019 to 2020, incontinence supplies such as liners and pads accounted for 28.4% of all medical supply claims. Hearing aid supplies, such as batteries, represented 20.8% of all medical supply claims, followed by wound care supplies at 17.7%.
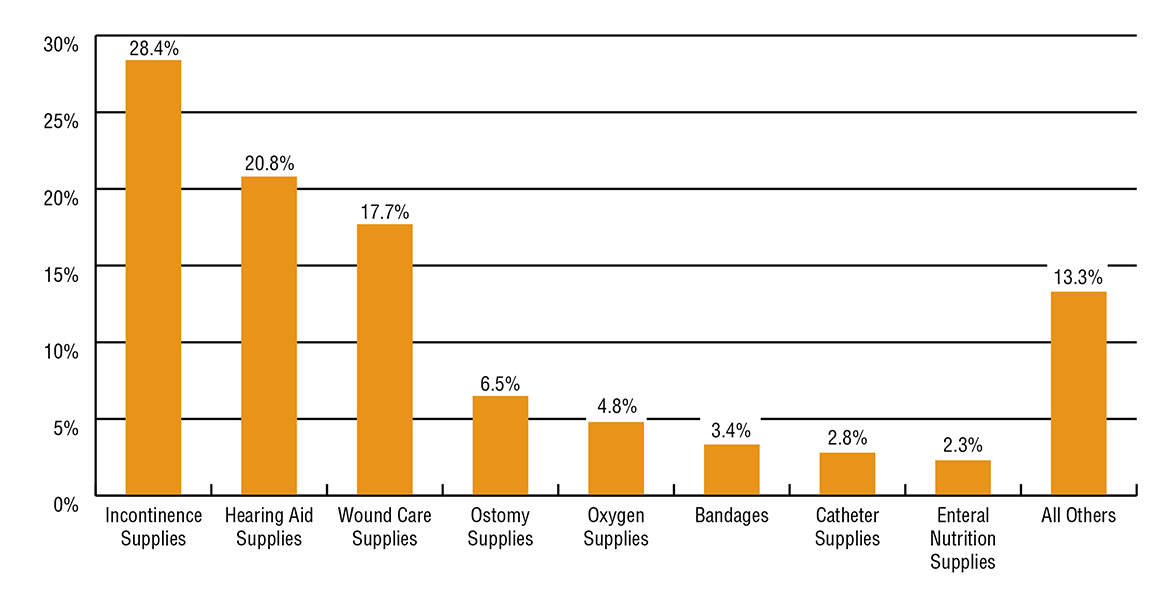
Source: HICPS adapted by Business Support, Audit and Negotiations Division
Text alternative for Figure 4.12: NIHB medical supplies by category and claims incidence: 2019 to 2020
This bar graph visually describes percentage of NIHB medical supply claims by category, as follows:
- hearing aid supplies is 20.8%
- wound care supplies is 17.7%
- ostomy supplies is 6.5%
- oxygen supplies is 4.8%
- bandages is 3.4%
- catheter supplies is 2.8%
- enteral nutrition supplies is 2.3%
- all others is 13.3%.
Figure 4.13: NIHB medical equipment by category and claims incidence: 2019 to 2020
Figure 4.13 shows the variation in medical equipment claims incidence by category.
Claims for hearing aids accounted for 22.0% of all medical equipment claims in 2019 to 2020. Oxygen equipment was the next highest category at 21.0%, followed by limb orthoses at 10.7% and walking aids at 7.6%.
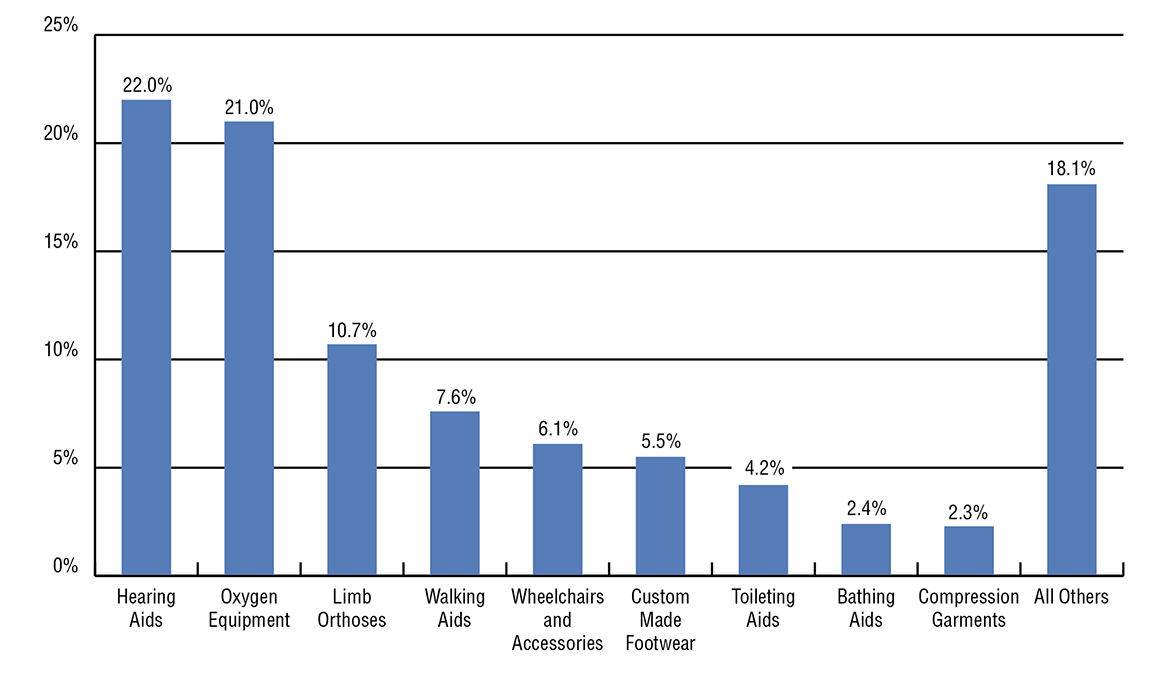
Source: HICPS adapted by Business Support, Audit and Negotiations Division
Text alternative for Figure 4.13: NIHB medical equipment by category and claims incidence: 2019 to 2020
This bar graph visually describes percentage of NIHB medical equipment claims by category, as follows:
- hearing aids is 22.0%
- oxygen equipment is 21.0%
- limb orthoses is 10.7%
- walking aids is 7.6%
- wheelchairs and accessories is 6.1%
- custom made footwear is 5.5%
- toileting aids is 4.2%
- bathing aids is 2.4%
- compression garments is 2.3%
- all others is 18.1%
Section 5: NIHB dental expenditure and utilization data
The NIHB program covers a broad range of dental services including:
- diagnostic services such as examinations and radiographs
- preventive services such as scaling, polishing, fluorides and sealants
- restorative services such as fillings and crowns
- endodontic services such as root canal treatments
- periodontal services such as deep scaling
- removable prosthodontic services such as dentures
- oral surgery services such as extractions
- orthodontic services such as braces
- adjunctive services such as general anaesthesia and sedation
In 2019 to 2020, a total of 326,193 First Nations and Inuit clients accessed dental benefits through the NIHB program, based on claims paid through the HICPS system. The total expenditure for dental benefit claims was $282.9 million or 18.6% of total NIHB expenditures. The dental benefit accounts for the third largest program expenditure.
Some dental services require predetermination prior to the initiation of treatment. Predetermination is a review that determines if the proposed dental service is covered under the program's guidelines and criteria, as described in the NIHB Dental Benefits Guide. This review is undertaken by the Dental Predetermination Centre (DPC).
Figure 5.1: Distribution of NIHB dental expenditures ($ millions): 2019 to 2020
Figure 5.1 illustrates the distinct components of dental expenditures under the NIHB program. Fee-for-service dental costs paid through the Health Information and Claims Processing Services (HICPS) system represented the largest expenditure component, accounting for $253.2 million or 89.5% of all NIHB Dental costs.
The next highest component was contribution agreements, which accounted for $15.0 million or 5.3% of total dental expenditures. Contribution agreements are used to fund the provision of dental benefits through agreements such as those with the Mohawk Council of Akwesasne in Ontario and the Bigstone Cree Nation in Alberta.
Expenditures for contract dentists providing services to clients in remote communities totalled $9.4 million or 3.3% of total costs.
Other costs totalled $5.4 million or 1.9% in 2019 to 2020. The majority of these costs are related to benefit claims processing through the HICPS system.
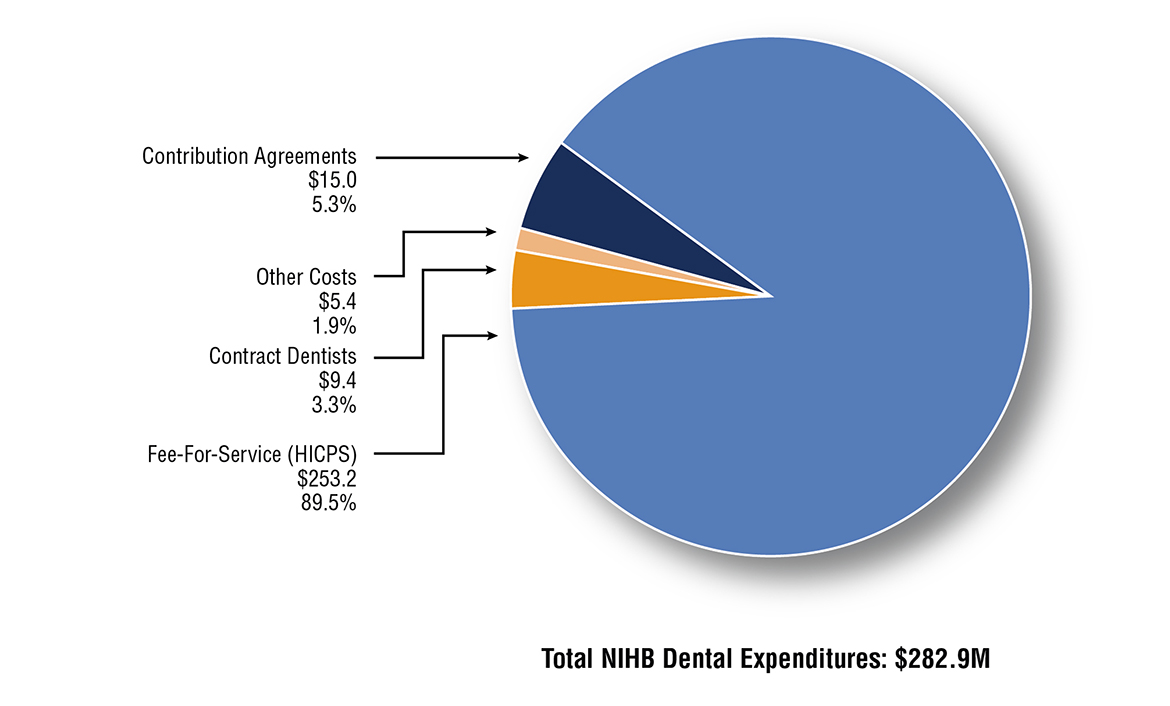
Source: FST adapted by Business Support, Audit and Negotiations Division
Text alternative for Figure 5.1: Distribution of NIHB dental expenditures ($ millions): 2019 to 2020
This pie chart visually describes NIHB dental expenditures in millions and proportion of dental expenditure by component type.
- expenditures for fee-for-service (HICPS) are $253.2 and 89.5%
- contract dentists is $9.4 and 3.3%
- other costs is $5.4 and 1.9%
- contribution agreements is $15.0 and 5.3%
- total dental expenditures are $282.9
Figure 5.2: Total NIHB dental expenditures by type and region ($ 000's): 2019 to 2020
Of the $282.9 million in NIHB dental expenditures in 2019 to 2020, Saskatchewan (20.4%), Ontario (19.6%), Alberta (19.4%) and Manitoba (18.6%) had the largest overall proportion. Saskatchewan had the highest total dental expenditures at $57.6 million and the Atlantic region had the lowest total dental expenditures at $11.5 million.
| Region | Operating | Total operating costs | Total contribution costs | Total costs | ||
|---|---|---|---|---|---|---|
| Fee-for-service | Contract dentists | Other costs | ||||
| Atlantic | $11,545 | $0 | $0 | $11,545 | $0 | $11,545 |
| Quebec | $18,621 | $0 | $0 | $18,621 | $113 | $18,733 |
| Ontario | $45,968 | $2,392 | $0 | $48,360 | $7,025 | $55,386 |
| Manitoba | $45,032 | $6,556 | $0 | $51,588 | $1,034 | $52,622 |
| Saskatchewan | $53,668 | $0 | $0 | $53,668 | $3,971 | $57,639 |
| Alberta | $52,308 | $41 | $0 | $52,348 | $2,645 | $54,993 |
| North | $25,946 | $377 | $0 | $26,322 | $223 | $26,546 |
| Headquarters | $0 | $0 | $5,361 | $5,361 | $0 | $5,361 |
| Total | $253,170 | $9,365 | $5,361 | $267,897 | $15,012 | $282,908 |
| Source: FST adapted by Business Support, Audit and Negotiations Division | ||||||
Figure 5.3: Annual NIHB dental expenditures
NIHB dental expenditures increased by 5.2% during fiscal year 2019 to 2020.
Over the last 5 years, annual growth rates for NIHB Dental expenditures have ranged from a high of 8.6% in 2016 to 2017 to a low of 5.2% in 2019 to 2020.
Figure 5.3.1: NIHB Dental expenditures and annual percentage change
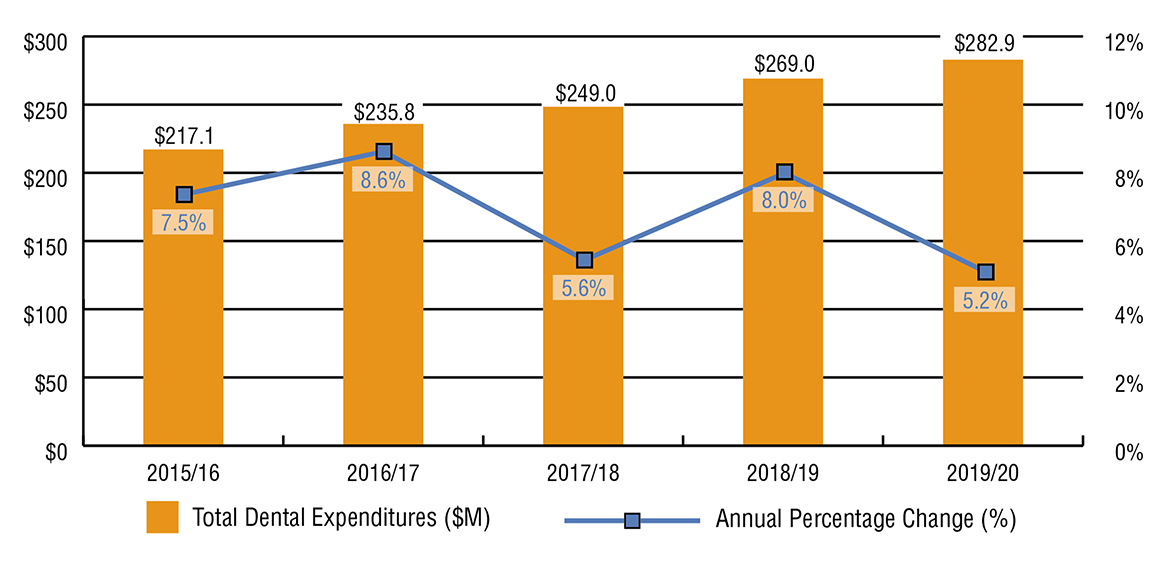
Source: FST adapted by Business Support, Audit and Negotiations Division
Text alternative for Figure 5.3.1: NIHB Dental expenditures and annual percentage change
This image visually describes NIHB dental expenditures in millions and annual percentage change by fiscal year, as follows:
- 2015 to 2016 is $217.1 and 7.5%
- 2016 to 2017 is $235.8 and 8.6%
- 2017 to 2018 is $249.0 and 5.6%
- 2018 to 2019 is $269.0 and 8.0%
- 2019 to 2020 is $282.9 and 5.2%
Figure 5.3.2: NIHB dental expenditures by region
| Region | 2015 to 2016 | 2016 to 2017 | 2017 to 2018 | 2018 to 2019 | 2019 to 2020 |
|---|---|---|---|---|---|
| Atlantic | $8,846 | $9,593 | $10,610 | $10,841 | $10,841 |
| Quebec | $16,641 | $17,569 | $17,961 | $17,882 | $17,882 |
| Ontario | $49,903 | $52,105 | $52,101 | $53,667 | $53,667 |
| Manitoba | $36,764 | $39,986 | $41,949 | $48,099 | $48,099 |
| Saskatchewan | $41,028 | $47,321 | $50,635 | $55,603 | $55,603 |
| Alberta | $39,753 | $44,315 | $47,637 | $51,617 | $51,617 |
| North | $20,936 | $20,936 | $25,141 | $26,211 | $26,211 |
| Headquarters | $2,920 | $2,877 | $2,770 | $3,423 | $3,423 |
| Total | $217,109 | $235,831 | $249,038 | $269,008 | $282,908 |
| Source: FST and FIRMS adapted by Business Support, Audit and Negotiations Division | |||||
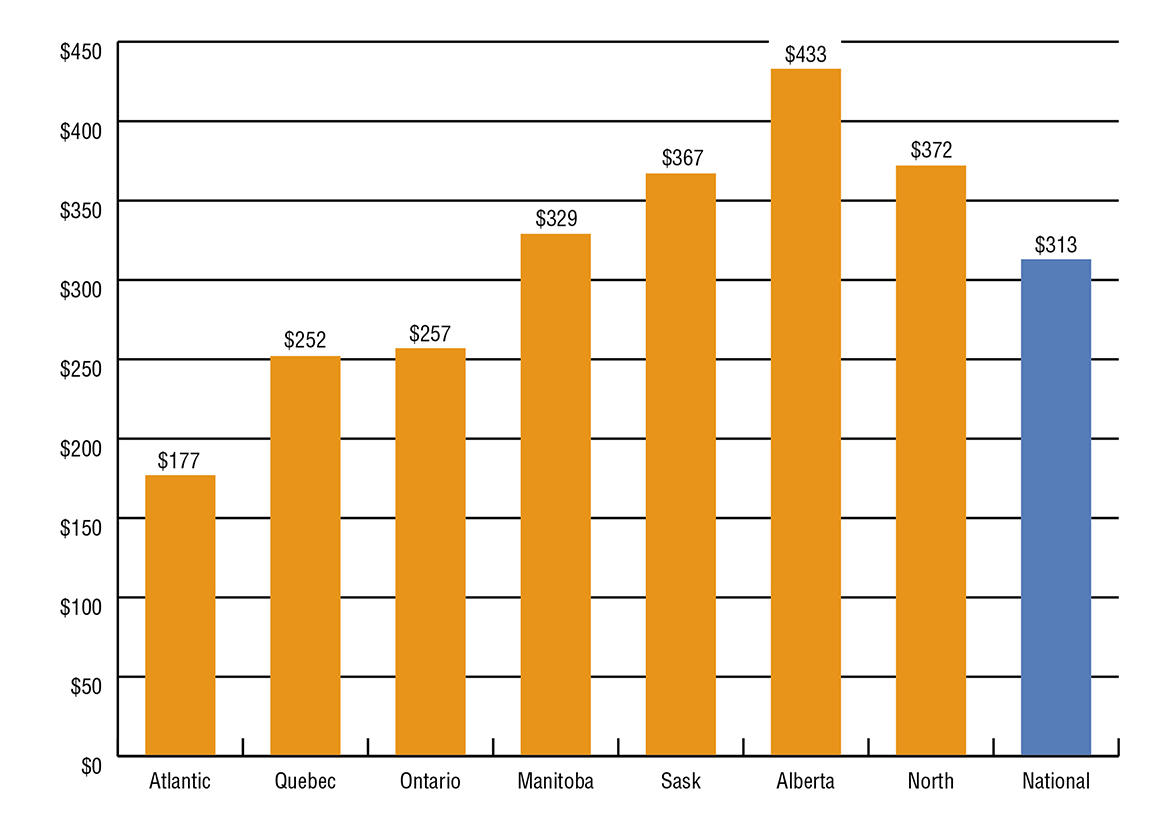
Figure 5.4: Per capita NIHB dental expenditures by region: 2019 to 2020
In 2019 to 2020, national per capita NIHB dental expenditures were $313, an increase of 3.6% from $302 in 2018 to 2019.
Alberta had the highest per capita dental expenditures at $433, followed by the Northern region at $372 and Saskatchewan at $367. The Atlantic region had the lowest per capita dental expenditures at $177 per eligible client.
Per capita values reflect NIHB dental expenditures only, and do not include additional dental services that may be provided to First Nations and Inuit populations through other Indigenous Services Canada programs or through transfers and other arrangements.
Source: FST and SVS adapted by Business Support, Audit and Negotiations Division
Text alternative for Figure 5.4: Per capita NIHB dental expenditures by region: 2019 to 2020
This bar graph visually describes NIHB dental expenditures per capita by region, as follows:
- Atlantic has $177
- Quebec has $252
- Ontario has $257
- Manitoba has $329
- Saskatchewan has $367
- Alberta has $433
- North has $372
- National has $313
Figure 5.5: NIHB dental fee-for-service expenditures per claimant by region: 2019 to 2020
In 2019 to 2020, national NIHB dental expenditures per claimant (i.e. eligible clients who received at least one dental benefit) was $776, an increase of 5.2% over the $738 in 2018 to 2019.
Alberta had the highest dental expenditures per claimant at $991 followed by the Northern region at $953, an increase of 5.9% and 4.5% respectively from $936 and $913 in the previous year.

Source: FST and HICPS adapted by Business Support, Audit and Negotiations Division
Text alternative for Figure 5.5: NIHB dental fee-for-service expenditures per claimant by region: 2019 to 2020
This bar graph visually describes NIHB dental expenditures per claimant by region, as follows:
- Atlantic has $490
- Quebec has $599
- Ontario has $674
- Manitoba has $753
- Saskatchewan has $889
- Alberta has $991
- North has $953
- National has $776
Figure 5.6: NIHB dental utilization rates by region
Utilization rates reflect the number of clients who, during the fiscal year, received at least one dental service paid through the HICPS system as a proportion of the total number of eligible clients.
In 2019 to 2020, the national utilization rate for dental benefits paid through the HICPS system was 37%. National NIHB dental utilization rates have increased slightly over the past five years.
- Dental utilization rates vary across the regions with the highest dental utilization rate found in Quebec and Alberta (42%). The lowest dental utilization rate was in Ontario (32%). Please note that the dental utilization rates understate the actual level of access, as these data do not include contract dental services provided in some regions or dental services provided through contribution agreements. For example, HICPS data does not capture any services utilized by the Bigstone Cree Nation. If this client population was removed from the Alberta Region's population, the utilization rate for dental benefits for Alberta would have been 44% in 2019 to 2020. The same scenario would apply for the Ontario Region. If the Akwesasne client population in Ontario were to be removed, the utilization rate for dental benefits in Ontario would have been 34%. If both the Bigstone and Akwesasne client populations were removed from the overall NIHB population, the national utilization rate for dental benefits would have been 38%. The utilization rate also does not reflect services received through Indigenous Services Canada programs such as dental therapy and the Children's Oral Health Initiative (COHI)
Over the 2 year period between 2018 to 2019 and 2019 to 2020, 444,303 distinct clients received NIHB Dental services through HICPS, resulting in an overall 50% utilization rate over this period.
| Region | Dental utilization | NIHB dental utilization last two years 2018 to 2020 | ||||
|---|---|---|---|---|---|---|
| 2015 to 2016 | 2016 to 2017 | 2017 to 2018 | 2018 to 2019 | 2019 to 2020 | ||
| Atlantic | 34% | 34% | 34% | 37% | 36% | 48% |
| Quebec | 45% | 44% | 44% | 43% | 42% | 54% |
| Ontario | 32% | 32% | 32% | 32% | 32% | 41% |
| Manitoba | 32% | 33% | 33% | 39% | 37% | 53% |
| Saskatchewan | 36% | 38% | 38% | 39% | 38% | 54% |
| Alberta | 40% | 41% | 40% | 42% | 42% | 56% |
| Yukon | 36% | 36% | 36% | 37% | 35% | 50% |
| N.W.T. | 40% | 41% | 41% | 41% | 39% | 54% |
| Nunavut | 40% | 38% | 38% | 40% | 38% | 55% |
| National | 35% | 36% | 36% | 37% | 37% | 50% |
| Source: HICPS and SVS adapted by Business Support, Audit and Negotiations Division | ||||||
Figure 5.7: NIHB dental claimants by age group, gender and region: 2019 to 2020
Of the 887,518 clients eligible to receive dental benefits through the NIHB program, 326,193 claimants (37%) received at least one dental procedure paid through the HICPS system in 2019 to 2020.
Of this total, 182,861 were female (56%) and 143,332 were male (44%), compared to the total eligible NIHB population where 51% were female and 49% were male.
The average age of dental claimants was 31 years, indicating clients tend to access dental services at a slightly younger age compared to pharmacy services (35 years of age). The average age for female and male claimants was 32 and 30 years of age respectively.
Approximately 37% of all dental claimants were under 20 years of age. Forty percent of male claimants were in this age group compared to 35 of female claimants. Approximately 6% of all claimants were seniors (ages 65 and over) in 2019 to 2020.
| Region | Atlantic | Quebec | Ontario | Manitoba | ||||||||
|---|---|---|---|---|---|---|---|---|---|---|---|---|
| Age group | Male | Female | Total | Male | Female | Total | Male | Female | Total | Male | Female | Total |
| 0-4 | 265 | 275 | 540 | 571 | 599 | 1,170 | 1,373 | 1,386 | 2,759 | 2,032 | 2,021 | 4,053 |
| 5-9 | 667 | 705 | 1,372 | 1,497 | 1,491 | 2,988 | 3,181 | 3,235 | 6,416 | 3,476 | 3,575 | 7,051 |
| 10-14 | 884 | 959 | 1,843 | 1,569 | 1,638 | 3,207 | 3,230 | 3,347 | 6,577 | 3,534 | 3,984 | 7,518 |
| 15-19 | 987 | 1,148 | 2,135 | 1,052 | 1,285 | 2,337 | 2,705 | 3,082 | 5,787 | 2,534 | 3,320 | 5,854 |
| 20-24 | 841 | 1,164 | 2,005 | 972 | 1,290 | 2,262 | 2,297 | 3,096 | 5,393 | 2,102 | 3,149 | 5,251 |
| 25-29 | 855 | 1,162 | 2,017 | 1,075 | 1,417 | 2,492 | 2,291 | 3,255 | 5,546 | 2,264 | 3,200 | 5,464 |
| 30-34 | 745 | 972 | 1,717 | 878 | 1,212 | 2,090 | 1,923 | 2,655 | 4,578 | 1,761 | 2,494 | 4,255 |
| 35-39 | 689 | 956 | 1,645 | 835 | 1,069 | 1,904 | 1,699 | 2,459 | 4,158 | 1,585 | 2,064 | 3,649 |
| 40-44 | 670 | 858 | 1,528 | 810 | 1,086 | 1,896 | 1,691 | 2,259 | 3,950 | 1,463 | 1,892 | 3,355 |
| 45-49 | 757 | 963 | 1,720 | 819 | 1,159 | 1,978 | 1,774 | 2,361 | 4,135 | 1,418 | 1,982 | 3,400 |
| 50-54 | 742 | 1,036 | 1,778 | 918 | 1,254 | 2,172 | 1,819 | 2,619 | 4,438 | 1,406 | 1,766 | 3,172 |
| 55-59 | 666 | 932 | 1,598 | 883 | 1,143 | 2,026 | 1,873 | 2,648 | 4,521 | 1,205 | 1,495 | 2,700 |
| 60-64 | 606 | 847 | 1,453 | 750 | 1,039 | 1,789 | 1,485 | 2,282 | 3,767 | 739 | 1,057 | 1,796 |
| 65+ | 919 | 1,272 | 2,191 | 1,120 | 1,670 | 2,790 | 2,314 | 3,844 | 6,158 | 915 | 1,384 | 2,299 |
| Total | 10,293 | 13,249 | 23,542 | 13,749 | 17,352 | 31,101 | 29,655 | 38,528 | 68,183 | 26,434 | 33,383 | 59,817 |
| Average age | 36 | 38 | 37 | 34 | 36 | 35 | 33 | 36 | 35 | 28 | 29 | 29 |
| Region | Saskatchewan | Alberta | North | Total | ||||||||
|---|---|---|---|---|---|---|---|---|---|---|---|---|
| Age group | Male | Female | Total | Male | Female | Total | Male | Female | Total | Male | Female | Total |
| 0-4 | 1,932 | 1,953 | 3,885 | 1,834 | 1,857 | 3,691 | 1,110 | 1,019 | 2,129 | 9,160 | 9,155 | 18,315 |
| 5-9 | 3,636 | 3,766 | 7,402 | 3,691 | 3,596 | 7,287 | 1,257 | 1,357 | 2,614 | 17,526 | 17,880 | 35,406 |
| 10-14 | 3,604 | 4,040 | 7,644 | 3,349 | 3,709 | 7,058 | 1,256 | 1,616 | 2,872 | 17,578 | 19,448 | 37,026 |
| 15-19 | 2,548 | 3,297 | 5,845 | 2,470 | 2,924 | 5,394 | 1,114 | 1,556 | 2,670 | 13,528 | 16,753 | 30,281 |
| 20-24 | 2,182 | 3,267 | 5,449 | 1,892 | 2,554 | 4,446 | 1,089 | 1,542 | 2,631 | 11,482 | 16,212 | 27,694 |
| 25-29 | 2,226 | 3,324 | 5,550 | 1,845 | 2,538 | 4,383 | 1,084 | 1,542 | 2,626 | 11,756 | 16,622 | 28,378 |
| 30-34 | 1,947 | 2,763 | 4,710 | 1,590 | 2,193 | 3,783 | 883 | 1,304 | 2,187 | 9,843 | 13,765 | 23,608 |
| 35-39 | 1,577 | 2,162 | 3,739 | 1,371 | 1,920 | 3,291 | 742 | 1,036 | 1,778 | 8,609 | 11,829 | 20,438 |
| 40-44 | 1,407 | 1,960 | 3,367 | 1,241 | 1,653 | 2,894 | 622 | 869 | 1,491 | 7,986 | 10,718 | 18,704 |
| 45-49 | 1,506 | 1,975 | 3,481 | 1,133 | 1,560 | 2,693 | 682 | 836 | 1,518 | 8,180 | 10,988 | 19,168 |
| 50-54 | 1,332 | 1,808 | 3,140 | 1,096 | 1,378 | 2,474 | 623 | 817 | 1,440 | 8,020 | 10,836 | 18,856 |
| 55-59 | 1,075 | 1,422 | 2,497 | 868 | 1,209 | 2,077 | 479 | 689 | 1,168 | 7,129 | 9,661 | 16,790 |
| 60-64 | 715 | 982 | 1,697 | 610 | 917 | 1,527 | 306 | 480 | 786 | 5,243 | 7,668 | 12,911 |
| 65+ | 794 | 1,176 | 1,970 | 665 | 1,104 | 1,769 | 525 | 776 | 1,301 | 7,292 | 11,326 | 18,618 |
| Total | 26,481 | 33,895 | 60,376 | 23,655 | 29,112 | 52,767 | 11,772 | 15,439 | 27,211 | 143,332 | 182,861 | 326,193 |
| Average age | 27 | 29 | 28 | 26 | 28 | 27 | 28 | 30 | 29 | 30 | 32 | 31 |
| Source: HICPS adapted by Business Support, Audit and Negotiations Division | ||||||||||||
Figure 5.8: NIHB fee-for-service dental expenditures by sub-benefit: 2019 to 2020
In 2019 to 2020, expenditures for restorative services (crowns, fillings, etc.) were the highest of all dental sub-benefit categories at $115.4 million. Diagnostic services (examinations, x-rays, etc.) at $31.8 million and preventive services (scaling, sealants, etc.) at $30.2 million were the next highest sub-benefit categories. Rounding out the top 5 were oral surgery (extractions, etc.) at $28.0 million and endodontic services (root canal treatments, etc.) at $18.6 million.
| Dental sub-benefit | 2018 to 2019 | 2019 to 2020 | % Change from 2018 to 2019 |
|---|---|---|---|
| Restorative services | $109.2 | $115.4 | 5.7% |
| Diagnostic services | $31.3 | $31.8 | 1.4% |
| Preventive services | $29.4 | $30.2 | 2.9% |
| Oral surgery | $26.9 | $28.0 | 3.8% |
| Endodontic services | $17.1 | $18.6 | 8.9% |
| Source: HICPS adapted by Business Support, Audit and Negotiations Division | |||
In 2019 to 2020, the 3 largest dental procedures by expenditure were composite restorations ($97.4 million), scaling ($22.3 million) and extractions ($19.6 million).
| Dental procedure | 2018 to 2019 | 2019 to 2020 | % Change from 2018 to 2019 |
|---|---|---|---|
| Composite restorations | $92.7 | $97.4 | 5.0% |
| Scaling | $22.3 | $22.3 | -0.2% |
| Extractions | $18.9 | $19.6 | 3.7% |
| Root canal therapy | $15.2 | $16.7 | 9.7% |
| Intraoral radiographs | $11.1 | $11.4 | 3.0% |
| Source: HICPS adapted by Business Support, Audit and Negotiations Division | |||
Figure 5.9: Distribution of eligible NIHB population, dental expenditures and incidence by age group: 2019 to 2020
The main drivers of NIHB Dental expenditures are increased rates of utilization and increases in the fees paid to dental professionals. The types of dental services provided also have an impact on expenditures.
The ratio of incidence to expenditures is relatively consistent across most age groupings; however, there are notable exceptions. For children aged 0 to 9, a larger number of low-cost procedures (e.g., low-cost restorative procedures such as fillings) are provided, so this group accounts for 23.7% of claims, but only 17.5 of expenditures.
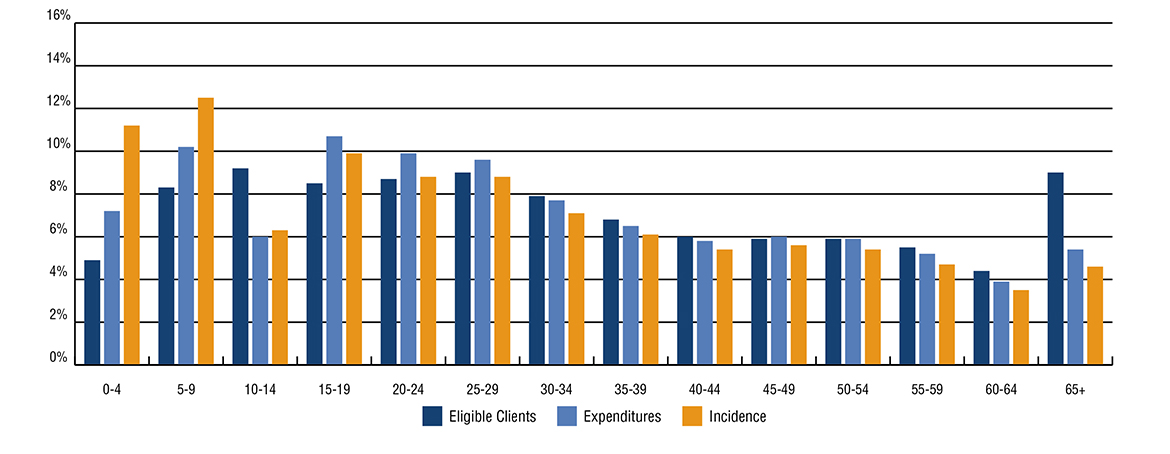
Source: HICPS and SVS adapted by Business Support, Audit and Negotiations Division
Text alternative for Figure 5.9: Distribution of eligible NIHB population, dental expenditures and incidence by age group: 2019 to 2020
This image visually describes distribution percentage of NIHB dental clients, incidence and expenditures by age group, as follows:
| Age | Eligible Clients | Expenditures | Incidence |
|---|---|---|---|
| 0–4 | 4.9% | 11.2% | 7.2% |
| 5–9 | 8.3% | 12.5% | 10.2% |
| 10–14 | 9.2% | 6.3% | 6.0% |
| 15–19 | 8.5% | 9.9% | 10.7% |
| 20–24 | 8.7% | 8.8% | 9.9% |
| 25–29 | 9.0% | 8.8% | 9.6% |
| 30–34 | 7.9% | 7.1% | 7.7% |
| 35–39 | 6.8% | 6.1% | 6.5% |
| 40–44 | 6.0% | 5.4% | 5.8% |
| 45–49 | 5.9% | 5.6% | 6.0% |
| 50–54 | 5.9% | 5.4% | 5.9% |
| 55–59 | 5.5% | 4.7% | 5.2% |
| 60–64 | 4.4% | 3.5% | 3.9% |
| 65+ | 9.0% | 4.6% | 5.4% |
| Total | 100.0% | 100.0% | 100.0% |
Section 6: NIHB Medical transportation expenditure and utilization data
In 2019 to 2020, NIHB medical transportation expenditures amounted to $537.2 million or 35.4% of total NIHB expenditures. The medical transportation benefit is the second largest program expenditure.
NIHB medical transportation benefits are intended to assist eligible clients to access medically necessary health services that cannot be obtained on reserve or in their community of residence.
Medical transportation benefits are managed by Indigenous Services Canada regional offices, or by First Nations or Inuit Health Authorities, organizations or territorial governments who manage the benefit through contribution agreements.
Medical transportation benefits include:
- ground travel (private vehicle, commercial taxi, fee-for-service driver and vehicle, band vehicle, bus, train, snowmobile taxi and ground ambulance)
- air travel (scheduled flights, chartered flights, helicopter and air ambulance)
- water travel (motorized boat, boat taxi and ferry)
- living expenses (meals and accommodations)
- transportation costs for health professionals to provide services to isolated communities
Medical Transportation benefits may be provided for clients to access the following types of medically required health services:
- medical services insured by provincial/territorial health plans (as an example, appointments with physician, diagnostic tests, hospital care)
- alcohol, solvent, drug abuse and detox treatments
- traditional healers
- eligible benefits and services covered by the NIHB program
Medical transportation benefits may also be provided for a medical escort (such as a nurse) or a non-medical escort (such as family member or caregiver) to travel with a client who needs assistance. As of July, 2017, NIHB provides coverage for a non-medical escort for all pregnant women who require transportation outside their community to deliver their babies.
In addition to facilitating client travel to appointments for these medical services, significant efforts have been made over the past few years to bring health care professionals to under-serviced and remote and isolated communities. These efforts facilitate access to medically necessary services in communities and can be more cost effective than bringing individual clients to the service provider.
Figure 6.1: Distribution of NIHB medical transportation expenditures ($ Millions): 2019 to 2020
In 2019 to 2020, NIHB medical transportation expenditures totalled $537.2 million. Figure 6.1 illustrates the components of medical transportation expenditures under the NIHB program.
Contribution agreements for the management of medical transportation benefits by First Nations bands, territorial governments and other organizations represented the largest component, accounting for $236.2 million, or 44.0% of total benefit expenditures.
Of benefits managed by the NIHB program, scheduled flights at $94.5 million (17.6%), living expenses at $69.7 million (13.0%) and air ambulance at $50.9 million (9.5%) were the largest expenditures, accounting for a combined total of over 40%.
Rounding out medical transportation expenditures are costs for land ambulance at $44.8 million (8.3%), land and water transportation at $24.7 million (4.6%) and chartered flights at $16.4 million (3.1%).
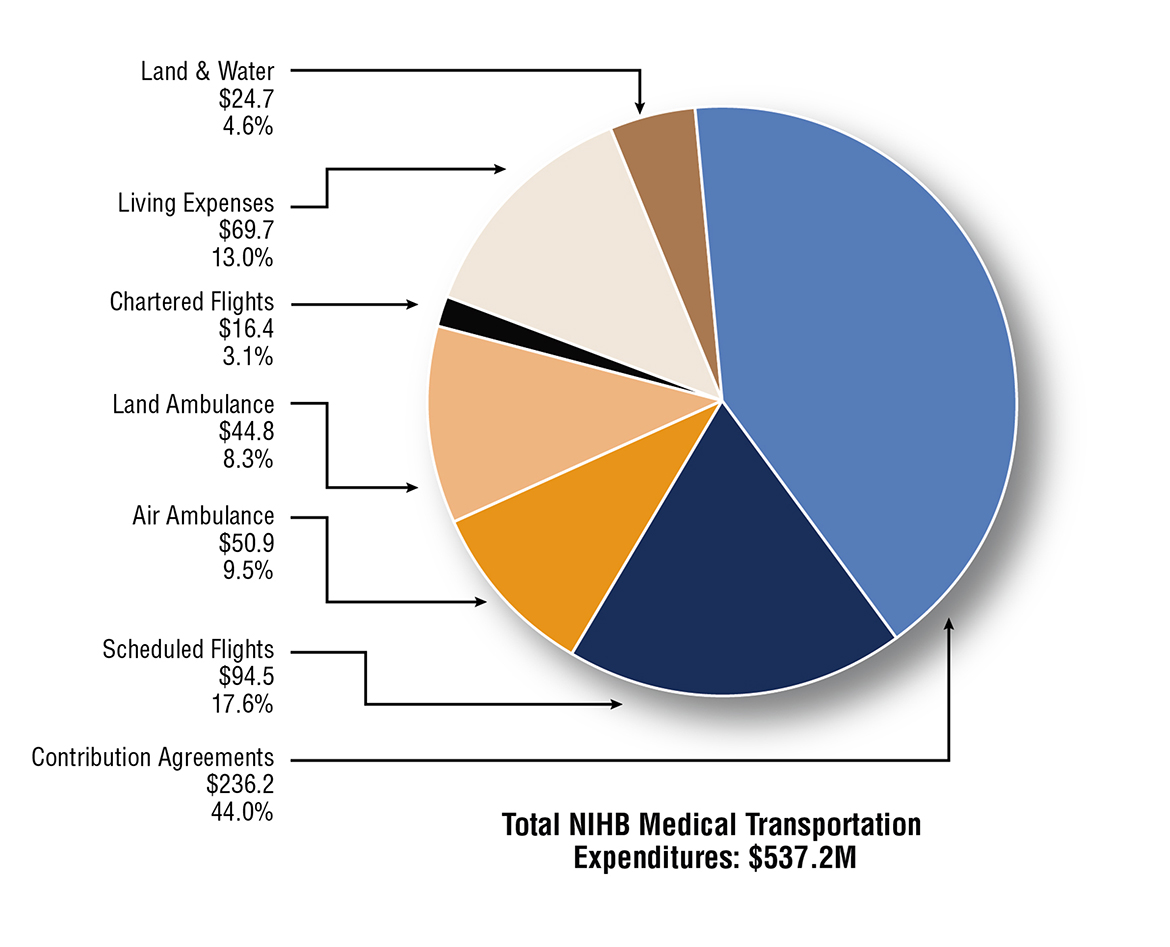
Source: FST adapted by Business Support, Audit and Negotiations Division
Text alternative for Figure 6.1: Distribution of NIHB medical transportation expenditures ($ Millions): 2019 to 2020
This image is a pie chart which visually describes NIHB medical transportation expenditures and percentage by type, as follows:
- scheduled flights is $94.5, 17.6%
- living expenses is $69.7, 13.0%
- land ambulance is $50.9, 9.5%
- air ambulance is $44.8, 8.3%
- land and water is $24.7, 4.6%
- chartered flights is $16.4, 3.1%
- contribution agreements is $236.2, 44.0%
- total is $537.2
Figure 6.2: Annual NIHB medical transportation expenditures
NIHB medical transportation expenditures increased by 8.5% in 2019 to 2020 compared to the previous year. Over the past 5 years, overall medical transportation costs have grown by 42.9% from $375.9 million in 2015 to 2016 to $537.2 million in 2019 to 2020.
On a regional basis, the highest growth rates over this period were in the Atlantic region where expenditures grew by 66.0% from $8.4 million in 2015 to 2016 to $13.9 million in 2019 to 2020. This was followed by the Ontario region with an increase of 57.3% from $67.8 million in 2015 to 2016 to $106.6 million in 2019 to 2020.
Manitoba had the highest total medical transportation expenditures at $168.7 million and had the largest net increase in expenditures over the past five years as medical transportation costs grew by $43.4 million over this period. The Ontario region had the second largest net increase in expenditures over the past five years at $38.9 million followed by Saskatchewan at $30.4 million.
Figure 6.2.1: NIHB medical transportation expenditures and annual percentage change

Source: FST adapted by Business Support, Audit and Negotiations Division
Text alternative for Figure 6.2.1: NIHB medical transportation expenditures and annual percentage change
This image is a bar graph which visually describes NIHB medical transportation expenditures and percentage growth by year, as follows:
- 2015 to 2016 expenditures are $375.9 and percentage change 5.0%
- 2016 to 2017 are $417.0 and 10.9%
- 2017 to 2018 are $459.5 and 10.2%
- 2018 to 2019 are $495.0 and 7.7%
- 2019 to 2020 are $537.2 and 8.5%
Figure 6.2.2: NIHB medical transportation expenditures by region ($ 000's)
| Region | 2015 to 2016 | 2016 to 2017 | 2017 to 2018 | 2018 to 2019 | 2019 to 2020 |
|---|---|---|---|---|---|
| Atlantic | $8,380 | $9,277 | $11,147 | $11,820 | $13,910 |
| Quebec | $23,687 | $23,501 | $23,918 | $24,642 | $25,729 |
| Ontario | $67,772 | $74,890 | $86,091 | $98,605 | $106,638 |
| Manitoba | $125,308 | $147,167 | $155,370 | $156,961 | $168,686 |
| Saskatchewan | $53,566 | $58,902 | $64,363 | $75,330 | $83,947 |
| Alberta | $46,252 | $48,157 | $51,187 | $56,870 | $61,669 |
| North | $50,940 | $55,125 | $67,413 | $70,806 | $76,601 |
| Total | $375,904 | $417,019 | $459,489 | $495,034 | $537,179 |
| Source: FST and FIRMS adapted by Business Support, Audit and Negotiations Division | |||||
Figure 6.3: NIHB medical transportation expenditures by type and region ($ 000's): 2019 to 2020
The Atlantic region had the largest percentage increase in medical transportation expenditures in 2019 to 2020, with an increase of 17.7% from the previous fiscal year. Saskatchewan followed with an 11.4% increase in expenditures.
In 2019 to 2020 Manitoba had the highest overall NIHB medical transportation expenditures at $168.7 million, primarily as a result of air transportation, which totalled $93.9 million. High medical transportation costs in the region reflect in part the large number of First Nations clients living in remote or fly-in only northern communities.
The Ontario region represented the second highest medical transportation expenditures total in 2019 to 2020 at $106.6 million. Saskatchewan and the Northern region followed at $83.9 million and $76.6 million, respectively.
| Type | Atlantic | Quebec | Ontario | Manitoba | Saskatchewan | Alberta | North | Total |
|---|---|---|---|---|---|---|---|---|
| Scheduled flights | $2,109 | $229 | $37,173 | $43,168 | $8,879 | $1,215 | $1,772 | $94,544 |
| Air ambulance | $63 | $0 | $41 | $38,803 | $6,735 | $2,769 | $2,477 | $50,889 |
| Chartered flights | $15 | $0 | $374 | $11,888 | $1,815 | $2,294 | $0 | $16,386 |
| Land ambulance | $573 | $235 | $473 | $9,964 | $22,407 | $11,114 | $4 | $44,769 |
| Land & water | $1,293 | $100 | $3,791 | $4,757 | $12,356 | $1,502 | $909 | $24,708 |
| Living expenses | $1,119 | $40 | $25,068 | $25,762 | $8,762 | $6,905 | $2,046 | $69,702 |
| Total operating | $5,172 | $603 | $66,921 | $134,342 | $60,954 | $25,798 | $7,209 | $300,998 |
| Total contributions | $8,738 | $25,126 | $39,717 | $34,344 | $22,993 | $35,871 | $69,392 | $236,181 |
| Total | $13,910 | $25,729 | $106,638 | $168,686 | $83,947 | $61,669 | $76,601 | $537,179 |
| % Change from 2018 to 2019 | 17.7% | 4.4% | 8.1% | 7.5% | 11.4% | 8.4% | 8.2% | 8.5% |
| Source: FST and FIRMS adapted by Business Support, Audit and Negotiations Division | ||||||||
Figure 6.4: NIHB medical transportation contribution and operating expenditures by region ($ Millions): 2019 to 2020
Figure 6.4 compares contribution funding to operating costs in NIHB medical transportation. Contribution funding is provided to First Nations bands, territorial governments and other organizations to manage elements of the medical transportation benefit (e.g., coordinating accommodations, managing ground transportation, etc.), whereas operating costs are medical transportation benefits that are managed directly by Indigenous Services Canada regional offices.
Manitoba region had the largest operating expenditures for NIHB medical transportation in 2019 to 2020 at $134.3 million. This higher cost in the Manitoba region is due largely to the high number of clients living in remote or fly-in only communities in the northern areas of the province who require air travel to access health services in Winnipeg. The Ontario region had the next largest operating expenditures at $66.9 million, followed by the Saskatchewan region at $61.0 million. Together these three regions accounted for 87.1% of all operating expenditures for medical transportation.
In 2019 to 2020, the Northern region had the largest contribution expenditures for NIHB medical transportation at $69.4 million, followed by the regions of Ontario and Alberta at $39.7 million and $35.9 million, respectively. Almost all NIHB medical transportation services were delivered via contribution agreements in Quebec.

Source: FST adapted by Business Support, Audit and Negotiations Division
Text alternative for Figure 6.4: NIHB medical transportation contribution and operating expenditures by region ($ Millions): 2019 to 2020
This image visually describes NIHB medical transportation expenditures by region and type, as follows:
Total contribution expenditure for:
- Atlantic are $8.7
- Quebec are $25.1
- Ontario are $39.7
- Manitoba are $34.3
- Saskatchewan are $23.0
- Alberta are $35.9
- North are $69.4
- Total $236.2
Total operating expenditures for:
- Atlantic are $45.2
- Quebec are $0.6
- Ontario are $66.9
- Manitoba are $134.3
- Saskatchewan are $61.0
- Alberta are $25.8
- North are $7.2
- Total $301.0
Figure 6.5: NIHB medical transportation operating expenditures by type ($ Millions): 2019 to 2020
In 2019 to 2020, scheduled flights represented the largest portion of NIHB's medical transportation operating expenditures at $94.5 million or 31.4% of the total national operating expenditures. Living expenses, which include accommodations and meals, was the second highest at $69.7 million, or 23.2% of operating expenditures. Air ambulance followed at $50.9 million or 14.9%, and land ambulance costs comprised $44.8 million or 16.9% of medical transportation operating costs.
Private vehicle expenditures ($4.3 million) are the costs reimbursed through a per-kilometre allowance for private vehicle used by a client to access eligible health services. The NIHB private vehicle kilometric allowance rates are directly linked to the National Joint Council's (NJC) Government Commuting Assistance Directive Lower Kilometric Rates.
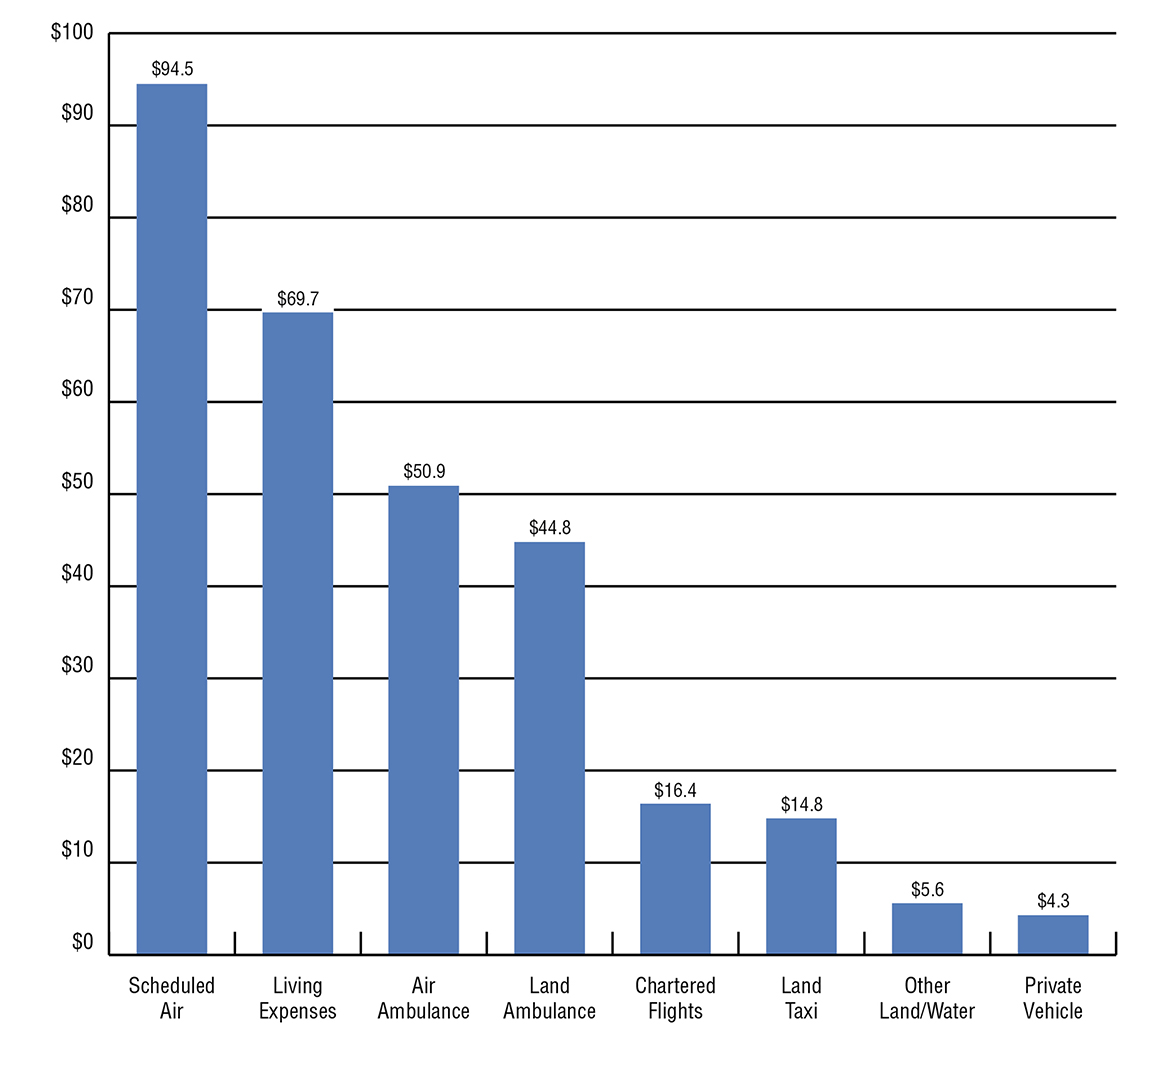
Source: FST adapted by Business Support, Audit and Negotiations Division
Text alternative for Figure 6.5: NIHB medical transportation operating expenditures by type ($ Millions): 2019 to 2020
This bar graph visually describes NIHB medical transportation expenditures by category, as follows:
- scheduled air is $94.5
- living expenses is $69.7
- air ambulance is $50.9
- land ambulance is $44.8
- chartered flights is $16.4
- land taxi is $14.8
- other land and water is $5.6
- private vehicle is $4.3
Figure 6.6: Per capita NIHB medical transportation expenditures by region: 2019 to 2020
In 2019 to 2020, the national per capita expenditures for NIHB medical transportation benefits was $615.
The Northern region recorded the highest per capita expenditures in medical transportation at $1,073, followed by Manitoba at $1,055. These expenditures reflect the large number of First Nations and Inuit clients living in remote or fly-in communities that need to fly south for health services.
In contrast, the Atlantic region had the lowest per capita expenditures at $213, a slight increase from $185 in the previous year. Compared to other regions, this lower per capita cost is reflective of the geography of the region, which allows easier access to health services with less need for air travel.
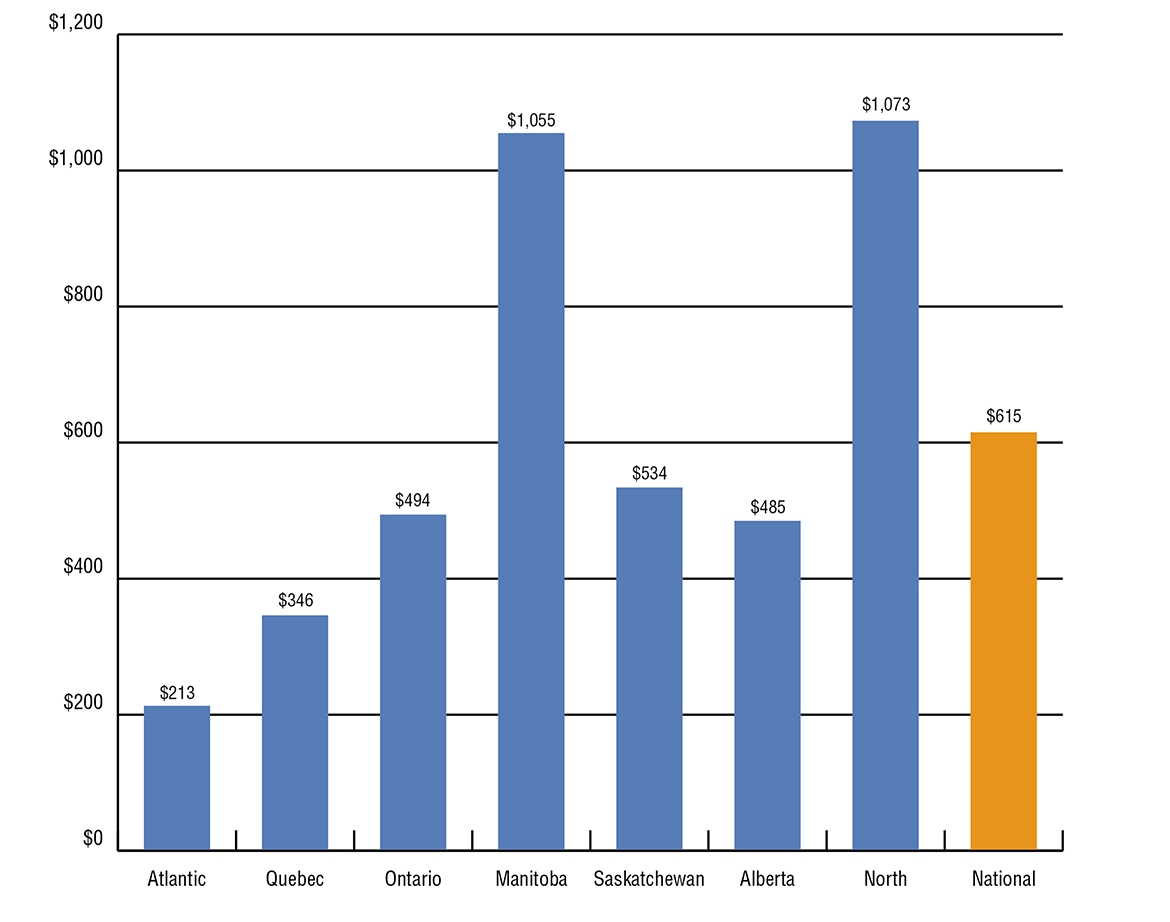
Source: SVS and FST adapted by Business Support, Audit and Negotiations Division
Text alternative for Figure 6.6: Per capita NIHB medical transportation expenditures by region: 2019 to 2020
This bar graph visually describes NIHB per capita medical transportation expenditures by region, as follows:
- Atlantic at $213
- Quebec at $346
- Ontario at $494
- Manitoba at $1,055
- Saskatchewan at $534
- Alberta at $485
- North at $1,073
- National at $615
Section 7: NIHB vision benefits, mental health counselling benefits and other health care benefits data
The NIHB program provides coverage for vision care benefits as set out in the NIHB Guide to Vision Benefits, including:
- eye examinations when they are not insured by the province or territory
- corrective eyewear (glasses, contact lenses) when prescribed by a vision care professional
- eyeglass repairs
- other vision care benefits depending on the specific medical needs of the client.
Some items such as ocular prosthesis and low vision aids are covered by NIHB as medical supplies and equipment benefits.
The NIHB program provides coverage for mental health benefits as set out in the NIHB Guide to Mental Health Counselling Services. The NIHB mental health counselling benefit is intended to provide coverage for mental health counselling to complement other mental wellness services that may be available. Mental health counselling is eligible for coverage when it is provided by an NIHB recognized mental health professional such as a registered psychologist. The provision of this benefit is part of FNIHB's commitment to work towards the development of a coordinated and comprehensive approach to mental health and addictions programming. The mental health counselling benefit is offered in a way that:
- recognizes the NIHB mental health counselling benefit as a component of a mental wellness continuum that includes other FNIHB, community-based and provincial/territorial mental health programming and services and
- supports culturally competent mental health counselling
NIHB other health care includes expenditures related to funding arrangements with the FNHA for clients eligible under Bills C-3 and S-3 and Qalipu clients, and for payment of health premiums for Inuit clients in British Columbia (up to January 1, 2020). Other expenditures also include funding for program oversight and partner contribution agreements.
In 2019 to 2020, the total combined expenditures for NIHB vision benefits ($46.0 million), mental health counselling benefits ($55.1 million) and other health care benefits ($12.0 million) was $113.1 million, or 7.4% of total NIHB expenditures for the fiscal year.
Figure 7.1: NIHB vision care expenditures and growth by region ($ 000's): 2019 to 2020
NIHB vision care expenditures totalled $46.0 million in 2019 to 2020. Regional operating expenditures accounted for $40.0 million ( 87.0%) of total expenditures while contribution costs accounted for $6.0 million (13.0%).
In 2019 to 2020 Alberta had the highest expenditures in NIHB vision benefits at $10.5 million, a percentage share of 22.9%, followed by Saskatchewan at $9.8 million (21.4%) and Ontario at $7.9 million (17.1%).
| Region | Operating | Contributions | Total |
|---|---|---|---|
| Atlantic | $4,150 | $0 | $4,150 |
| Quebec | $2,736 | $0 | $2,736 |
| Ontario | $7,250 | $610 | $7,860 |
| Manitoba | $6,374 | $560 | $6,935 |
| Saskatchewan | $9,844 | $0 | $9,844 |
| Alberta | $9,165 | $1,350 | $10,514 |
| North | $471 | $3,458 | $3,929 |
| Total | $39,990 | $5,978 | $45,968 |
| Source: FST adapted by Business Support, Audit and Negotiations Division | |||
Figure 7.2: Annual NIHB vision care expenditures
In 2019 to 2020, NIHB vision care expenditures increased by 26.1% from the previous year. Increased utilization and the implementation of a new fee structure contributed to this increase.
On a regional basis, the highest expenditures growth rate over this 5 year period was in Alberta where expenditures grew by 69.4% from $6.2 million in 2015 to 2016 to $10.5 million in 2019 to 2020. Alberta also had largest net increase in expenditures over this period, followed by Saskatchewan where costs grew by $3.7 million.
Figure 7.2.1: Annual NIHB vision care expenditures and percentage change
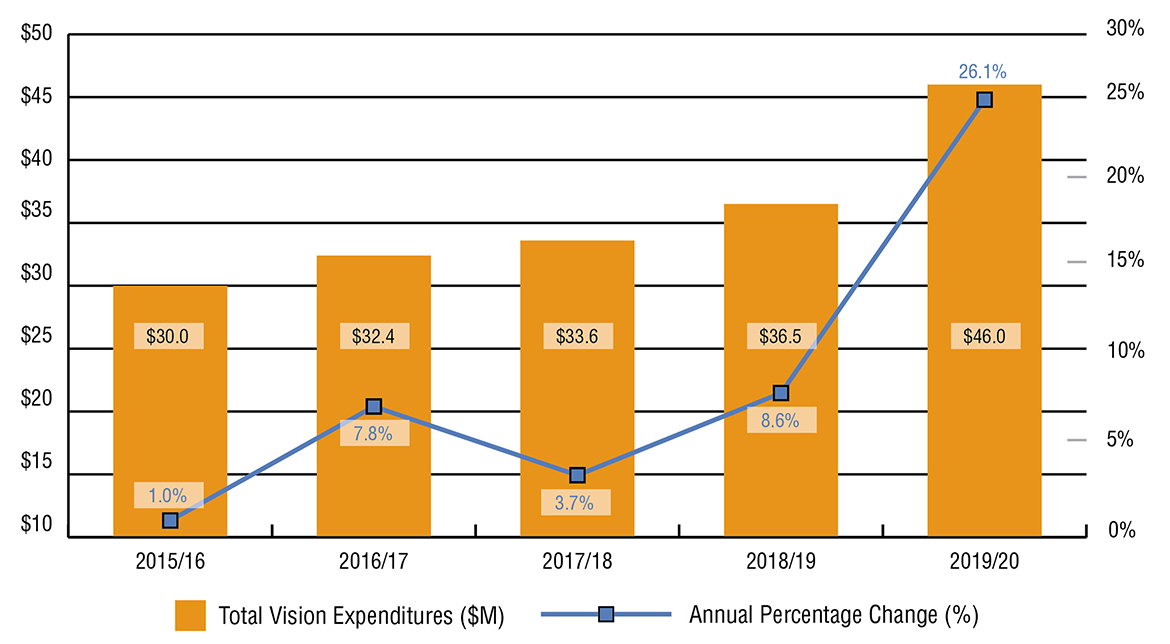
Source: FST adapted by Business Support, Audit and Negotiations Division
Text alternative for Figure 7.2.1: Annual NIHB vision care expenditures and percentage change
This image visually describes NIHB vision expenditures by year in millions and percentage change, as follows:
- 2015 to 2016 $30.0 and 1.0%
- 2016 to 2017 $32.4 and 7.8%
- 2017 to 2018 $33.6 and 3.7%
- 2018 to 2019 $36.5 and 8.6%
- 2019 to 2020 $46.0 and 26.1%
Figure 7.2.2: Annual NIHB vision care expenditures by region ($ 000's)
| Region | 2015 to 2016 | 2016 to 2017 | 2017 to 2018 | 2018 to 2019 | 2019 to 2020 |
|---|---|---|---|---|---|
| Atlantic | $3,021 | $3,502 | $3,632 | $3,885 | $4,150 |
| Quebec | $1,749 | $1,762 | $1,819 | $1,908 | $2,736 |
| Ontario | $6,160 | $6,223 | $6,848 | $6,744 | $7,860 |
| Manitoba | $4,212 | $4,204 | $4,479 | $4,699 | $6,935 |
| Saskatchewan | $6,104 | $6,533 | $6,905 | $7,822 | $9,844 |
| Alberta | $6,207 | $6,928 | $6,764 | $7,696 | $10,514 |
| North | $2,564 | $3,217 | $3,131 | $3,713 | $3,929 |
| Total | $30,017 | $32,370 | $33,578 | $36,467 | $45,968 |
| Source: FST adapted by Business Support, Audit and Negotiations Division | |||||
Figure 7.3: Per capita NIHB vision care expenditures by region: 2019 to 2020
In 2019 to 2020, national per capita expenditures in NIHB vision care benefits were $52.
Alberta had the highest per capita expenditures at $83, followed by the Atlantic region and Saskatchewan at $64 and $63 respectively. The lowest per capita NIHB vision care benefit expenditures were in Ontario at $36.
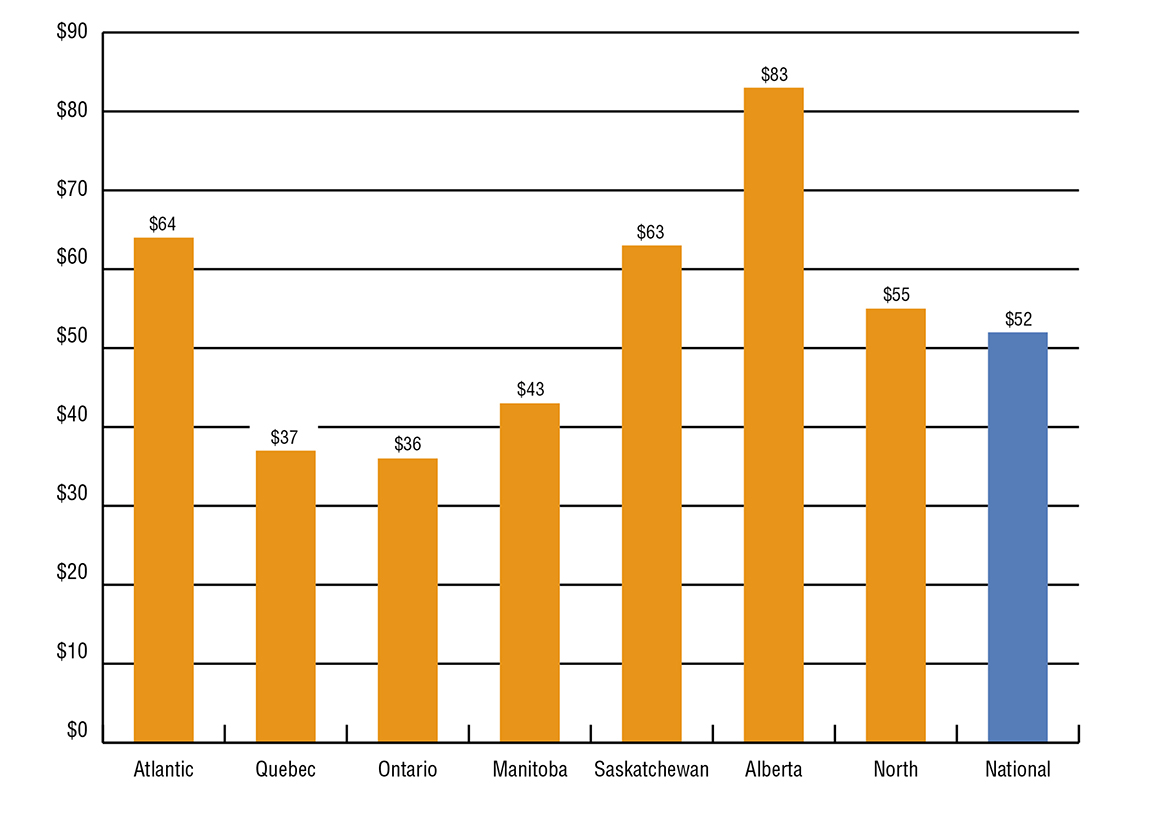
Source: SVS and FST adapted by Business Support, Audit and Negotiations Division
Text alternative for Figure 7.3: Per capita NIHB vision care expenditures by region: 2019 to 2020
This image visually describes NIHB per capita vision expenditures by region, as follows:
- Atlantic $64
- Quebec $37
- Ontario $36
- Manitoba $43
- Saskatchewan $63
- Alberta $84
- North $55
- National $52
Figure 7.4: NIHB mental health counselling expenditures by region ($ 000's): 2019 to 2020
In 2019 to 2020, NIHB mental health counselling expenditures amounted to $55.1 million. Regional operating expenditures accounted for $33.6 million (61.0%) of total expenditures, while contribution costs accounted for $21.5 million (39.0%).
In 2019 to 2020, Ontario had the highest percentage share of NIHB mental health counselling expenditures at 22.0%, followed by Saskatchewan and Manitoba at 21.4% and 20.8% respectively.
| Region | Operating | Contributions | Total |
|---|---|---|---|
| Atlantic | $1,671 | $1,757 | $3,428 |
| Quebec | $2,107 | $1,031 | $3,138 |
| Ontario | $10,851 | $1,266 | $12,116 |
| Manitoba | $7,811 | $3,663 | $11,475 |
| Saskatchewan | $4,136 | $7,646 | $11,783 |
| Alberta | $6,730 | $4,290 | $11,020 |
| North | $310 | $1,857 | $2,167 |
| Total | $33,616 | $21,510 | $55,126 |
| Source: FST adapted by Business Support, Audit and Negotiations Division | |||
Figure 7.5: NIHB mental health counselling expenditures and annual percentage change
NIHB mental health counselling expenditures increased by 29.2% during fiscal year 2019 to 2020. Over the past 5 years, overall mental health counselling costs have grown by 253.8% from $16.2 million in 2015 to 2016 to $55.1 million in 2019 to 2020. Budget 2017 provided funding to expand the benefit by removing the requirement that counselling be provided in response to a crisis.
On a regional basis, the highest growth rates over this period were in the Atlantic region where expenditures grew by 1923.4% from $419 thousand in 2015 to 2016 to $3.4 million in 2019 to 2020. This was followed by Saskatchewan with an increase of 771.9% from $1.6 million in 2015 to 2016 to $11.8 million in 2019 to 2020.
Ontario had the highest total mental health counselling expenditures at $12.1 million.
Figure 7.5.1: NIHB mental health counselling expenditures and annual percentage change
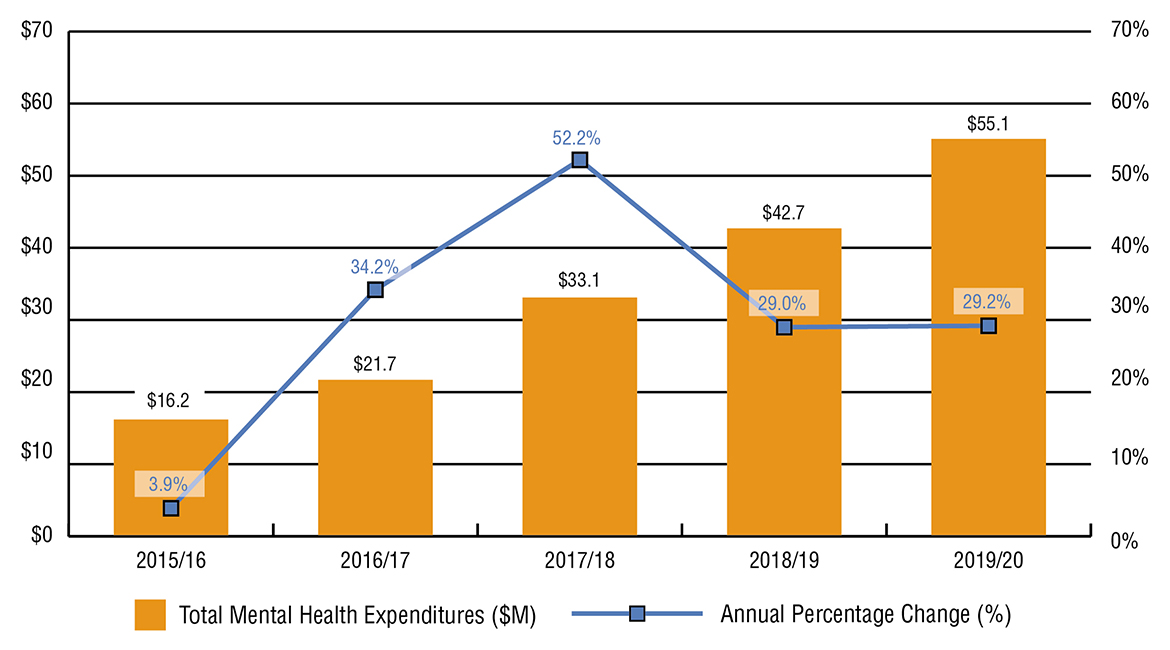
Source: FST adapted by Business Support, Audit and Negotiations Division
Text alternative for Figure 7.5.1: NIHB mental health counselling expenditures and annual percentage change
This image visually describes NIHB mental health counselling expenditures and annual percentage change by year, as follows:
- 2015 to 2016 is $16.2 and 3.9%
- 2016 to 2017 is $21.7 and 34.2%
- 2017 to 2018 is $33.1 and 52.2%
- 2018 to 2019 is $42.7 and 29.0%
- 2019 to 2020 is $55.1 and 29.2%
Figure 7.5.2: NIHB mental health counselling expenditures by region ($ 000's)
| Region | 2015 to 2016 | 2016 to 2017 | 2017 to 2018 | 2018 to 2019 | 2019 to 2020 |
|---|---|---|---|---|---|
| Atlantic | $419 | $601 | $1,204 | $1,932 | $3,428 |
| Quebec | $1,148 | $1,292 | $1,861 | $2,382 | $3,138 |
| Ontario | $3,021 | $4,091 | $6,028 | $9,053 | $12,116 |
| Manitoba | $3,780 | $5,635 | $8,124 | $9,705 | $11,475 |
| Saskatchewan | $1,631 | $3,304 | $6,559 | $7,867 | $11,783 |
| Alberta | $6,003 | $6,444 | $7,761 | $9,545 | $11,020 |
| North | $191 | $362 | $1,528 | $2,172 | $2,167 |
| Total | $16,193 | $21,728 | $33,066 | $42,656 | $55,126 |
| Source: FST and FIRMS adapted by Business Support, Audit and Negotiations Division | |||||
Figure 7.6: Per capita NIHB mental health counselling expenditures by region ($ 000's): 2019 to 2020
In 2019 to 2020, the national per capita expenditures for NIHB Mental Health Counselling were $62 per NIHB-eligible client.
Alberta had the highest per capita expenditures at $87, followed by Saskatchewan at $75 per NIHB-eligible client.
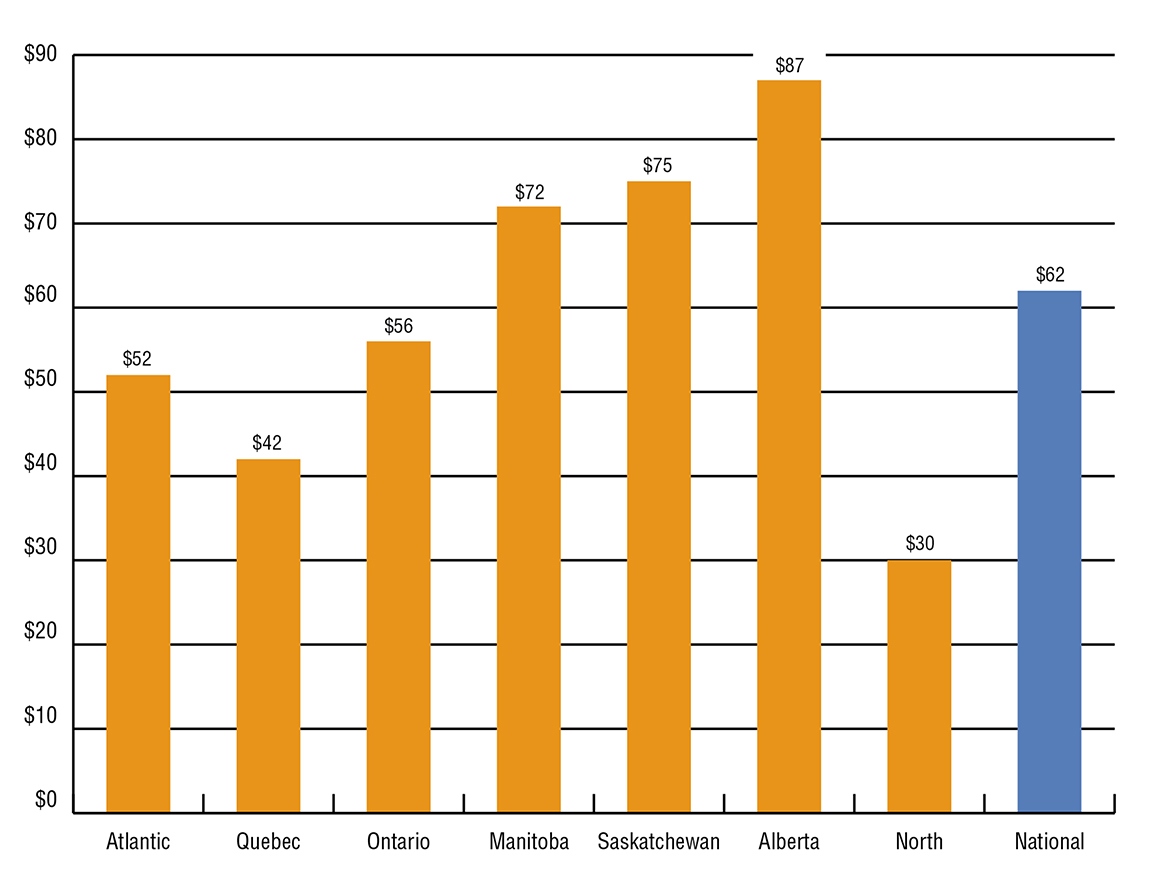
Source: SVS and FST adapted by Business Support, Audit and Negotiations Division
Text alternative for Figure 7.6: Per capita NIHB mental health counselling expenditures by region ($ 000's): 2019 to 2020
This image visually describes NIHB mental health counselling expenditures and annual percentage change, as follows:
- Atlantic is $52
- Quebec is $42
- Ontario is $56
- Manitoba is $72
- Saskatchewan is $75
- Alberta is $87
- North is $30
- National $62
Figure 7.7: NIHB other health care expenditures by region ($ 000's): 2019 to 2020
In 2019 to 2020, NIHB other health care expenditures totalled $12.0 million. The majority of these expenditures are related to contribution agreements, including funding arrangements with the FNHA for clients eligible under Bill C-3 and S-3, and Qalipu clients, and for payment of health premiums for Inuit clients in British Columbia (to January 1, 2020).
Other expenditures in this category include contribution agreements with national client partner organizations (Assembly of First Nations and Inuit Tapiriit Kanatami), as well as with regional First Nations and Inuit organizations that employ NIHB Navigators to act as a resource for communities, organizations or individuals who need assistance or information on the NIHB program.
| Region | Operating | Contributions | Total |
|---|---|---|---|
| Atlantic | $0 | $314 | $314 |
| Quebec | $2 | $488 | $490 |
| Ontario | $0 | $882 | $883 |
| Manitoba | $0 | $240 | $240 |
| Saskatchewan | $0 | $210 | $210 |
| Alberta | $4 | $200 | $204 |
| North | $0 | $498 | $498 |
| Headquarters | $70 | $9,090 | $9,160 |
| Total | $77 | $11,924 | $12,001 |
| Source: FST adapted by Business Support, Audit and Negotiations Division | |||
Section 8: Regional expenditure trends
Fiscal year 2010 to 2011 to fiscal year 2019 to 2020
Figure 8.1: Atlantic region
Annual expenditures in the Atlantic Region for 2019 to 2020 totalled $73.1 million, an increase of 15.4% over the $63.3 million spent in 2018 to 2019. Pharmacy expenditures in 2019 to 2020 increased by 15.7% to $39.7 million, medical transportation costs increased by 17.7% to $13.9 million and dental expenditures increased by 6.5% to $11.5 million. Mental health expenditures increased by 77.5% and vision care expenditures increased by 6.8%.
Pharmacy expenditures accounted for more than half of the Atlantic Region's total expenditures at 54.4%. Medical transportation expenditures ranked second at 19.0%, followed by dental at 15.8%. Vision care and mental health expenditures accounted for 5.7% and 4.7% of total expenditures respectively.
Over the 10 year period from 2010 to 2011 to 2019 to 2020, NIHB expenditures in the Atlantic Region were impacted by changes to the NIHB eligible client population. The creation of the Qalipu Mi'kmaq First Nation band in 2011 resulted in a 2 year surge in Atlantic Regional expenditures. As of March 31, 2020, a total of 23,210 Qalipu clients were eligible to receive benefits through the NIHB program. The decrease in expenditures in 2013 to 2014 can be attributed to the transfer of authority to the First Nations Health Authority for clients registered to Atlantic First Nations, but residing in British Columbia.
Figure 8.1.1: Percentage change in Atlantic region NIHB expenditures ($ 000's)
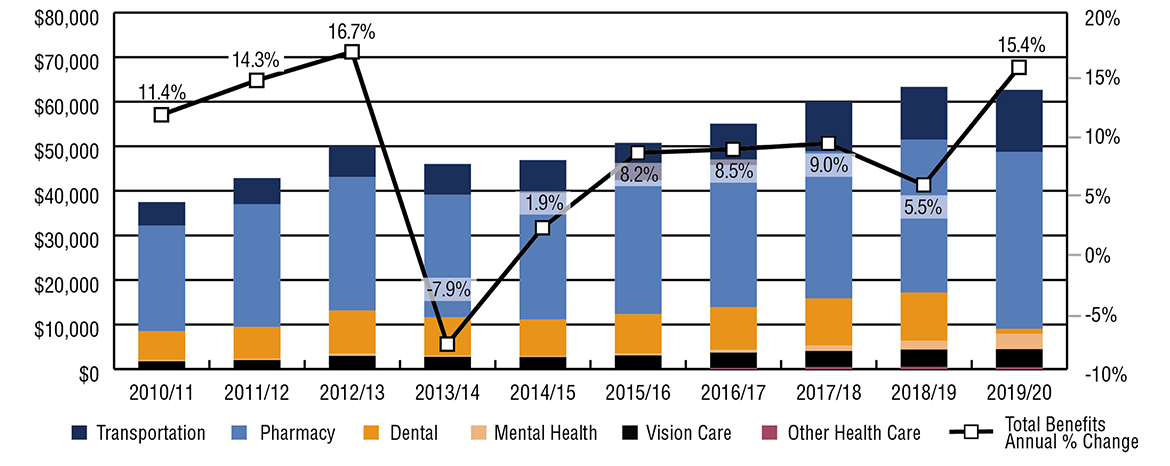
Source: FST adapted by Business Support, Audit and Negotiations Division
Text alternative for Figure 8.1.1: Percentage change in Atlantic region NIHB expenditures ($ 000's)
This image visually describes NIHB expenditures and annual percentage change in the Atlantic region, as follows:
| Atlantic region | 2010 to 2011 | 2011 to 2012 | 2012 to 2013 | 2013 to 2014 | 2014 to 2015 | 2015 to 2016 | 2016 to 2017 | 2017 to 2018 | 2018 to 2019 | 2019 to 2020 |
|---|---|---|---|---|---|---|---|---|---|---|
| Total expenditures ($M) | $37,482 | $42,850 | $49,995 | $46,033 | $46,912 | $50,773 | $55,079 | $60,040 | $63,342 | $73,071 |
| Total benefits annual % change | 11.4% | 14.3% | 16.7% | -7.9% | 1.9% | 8.2% | 8.5% | 9.0% | 5.5% | 15.4% |
Figure 8.1.2: Annual expenditures by benefit ($ 000's)
| Atlantic region | 2010 to 2011 | 2011 to 2012 | 2012 to 2013 | 2013 to 2014 | 2014 to 2015 | 2015 to 2016 | 2016 to 2017 | 2017 to 2018 | 2018 to 2019 | 2019 to 2020 |
|---|---|---|---|---|---|---|---|---|---|---|
| Transportation | $5,314 | $5,841 | $6,875 | $6,916 | $7,419 | $8,380 | $9,277 | $11,147 | $11,820 | $13,910 |
| Pharmacy | $23,689 | $27,571 | $29,979 | $27,517 | $28,398 | $30,064 | $31,899 | $33,021 | $34,348 | $39,724 |
| Dental | $6,481 | $7,164 | $9,660 | $8,609 | $8,238 | $8,846 | $9,593 | $10,610 | $10,841 | $11,545 |
| Mental health | $241 | $254 | $512 | $235 | $169 | $419 | $601 | $1,204 | $1,932 | $3,428 |
| Vision care | $1,758 | $2,021 | $2,969 | $2,757 | $2,666 | $3,021 | $3,502 | $3,632 | $3,885 | $4,150 |
| Other health care | $0 | $0 | $0 | $0 | $21 | $44 | $207 | $427 | $516 | $314 |
| Total | $37,482 | $42,850 | $49,995 | $46,033 | $46,912 | $50,773 | $55,079 | $60,040 | $63,342 | $73,071 |
| Source: FST adapted by Business Support, Audit and Negotiations Division | ||||||||||
Figure 8.2: Quebec
Annual expenditures in Quebec for 2019 to 2020 totalled $104.1 million, an increase of 8.3% from the $96.1 million spent in 2018 to 2019.
Pharmacy expenditures increased by 8.9% to $53.3 million and dental expenditures increased by 4.8% to $18.7 million, while medical transportation costs in 2019 to 2020 increased by 4.4% to $25.7 million. Mental health expenditures increased by 31.7% and vision care expenditures increased by 43.4%.
Pharmacy expenditures accounted for more than half of the Quebec region's total expenditures in 2019 to 2020 at 51.2%. Medical transportation expenditures ranked second at 24.7%, followed by dental at 18.0%. Mental health counselling and vision care expenditures accounted for 3.0% and 2.6% of total expenditures respectively.
Figure 8.2.1: Percentage change in Quebec NIHB expenditures ($ 000's)
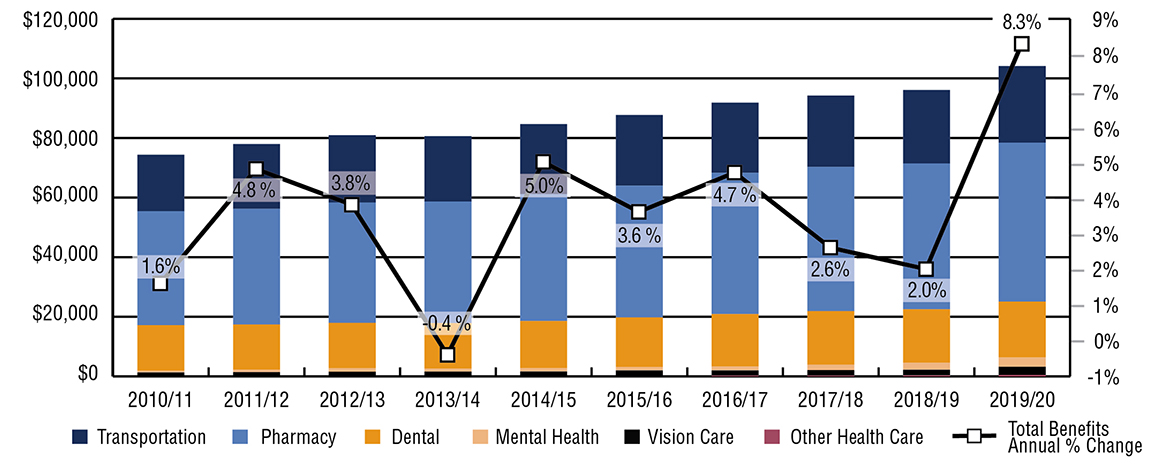
Source: FST and FIRMS adapted by Business Support, Audit and Negotiations Division
Text alternative for Figure 8.2.1: Percentage change in Quebec NIHB expenditures ($ 000's)
This image visually describes NIHB expenditures and annual percentage change in the Quebec region, as follows:
| Quebec region | 2010 to 2011 | 2011 to 2012 | 2012 to 2013 | 2013 to 2014 | 2014 to 2015 | 2015 to 2016 | 2016 to 2017 | 2017 to 2018 | 2018 to 2019 | 2019 to 2020 |
|---|---|---|---|---|---|---|---|---|---|---|
| Total expenditures ($M) | $74,355 | $77,951 | $80,915 | $80,608 | $84,666 | $87,690 | $91,831 | $94,210 | $96,120 | $104,136 |
| Total benefits annual % change | 1.6% | 4.8% | 3.8% | -0.4% | 5.0% | 3.6% | 4.7% | 2.6% | 2.0% | 8.3% |
Figure 8.2.2: Annual Expenditures by Benefit ($ 000's)
| Quebec | 2010 to 2011 | 2011 to 2012 | 2012 to 2013 | 2013 to 2014 | 2014 to 2015 | 2015 to 2016 | 2016 to 2017 | 2017 to 2018 | 2018 to 2019 | 2019 to 2020 |
|---|---|---|---|---|---|---|---|---|---|---|
| Transportation | $18,943 | $21,708 | $22,578 | $21,945 | $23,506 | $23,687 | $23,501 | $23,918 | $24,642 | $25,729 |
| Pharmacy | $38,234 | $38,827 | $40,393 | $40,825 | $42,581 | $44,206 | $47,444 | $48,390 | $48,967 | $53,311 |
| Dental | $15,245 | $15,138 | $15,239 | $15,216 | $15,799 | $16,641 | $17,569 | $17,961 | $17,882 | $18,733 |
| Mental health | $597 | $875 | $1,135 | $1,003 | $1,148 | $1,148 | $1,292 | $1,861 | $2,382 | $3,138 |
| Vision care | $1,336 | $1,404 | $1,570 | $1,619 | $1,622 | $1,749 | $1,762 | $1,819 | $1,908 | $2,736 |
| Other health care | $0 | $0 | $0 | $0 | $10 | $258 | $263 | $260 | $339 | $490 |
| Total | $74,355 | $77,951 | $80,915 | $80,608 | $84,666 | $87,690 | $91,831 | $94,210 | $96,120 | $104,136 |
| Source: FST adapted by Business Support, Audit and Negotiations Division | ||||||||||
Figure 8.3: Ontario
Annual expenditures in Ontario for 2019 to 2020 totalled $287.6 million, an increase of 6.9% from the $269.1 million spent in 2018 to 2019.
In 2019 to 2020, Ontario pharmacy expenditures increased by 4.2% to $104.7 million, while medical transportation costs increased by 8.1% to $106.6 million. Mental health counselling expenditures increased by 33.8%, while vision care expenditures increased by 16.6%.
Medical transportation expenditures accounted for 37.1% of the Ontario region's total expenditures. Pharmacy costs ranked second at 36.4%, followed by dental at 19.3%. Mental health and vision care expenditures accounted for 4.2% and 2.7% of total expenditures respectively.
Figure 8.3.1: Percentage change in Ontario NIHB expenditures ($ 000's)
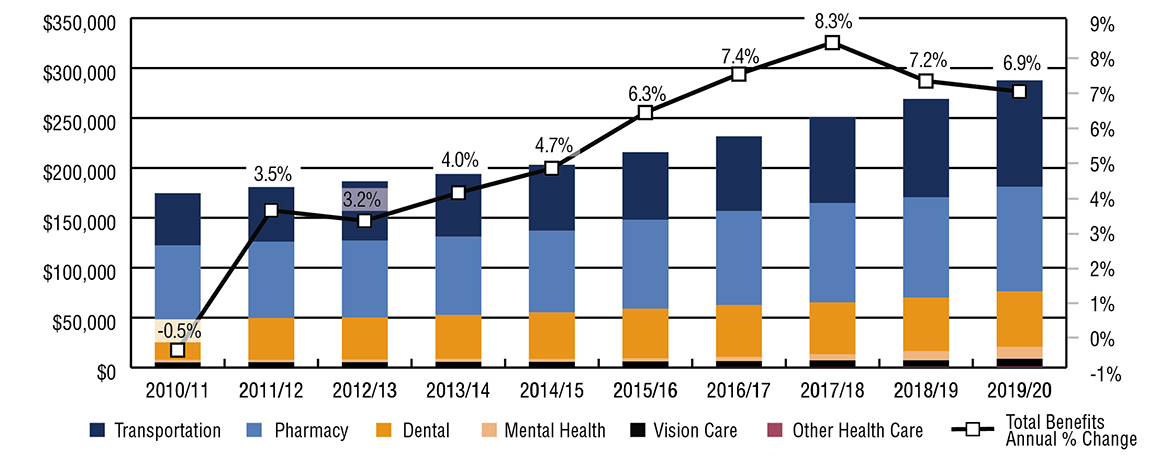
Source: FST adapted by Business Support, Audit and Negotiations Division
Text alternative for Figure 8.3.1: Percentage change in Ontario NIHB expenditures ($ 000's)
This image visually describes NIHB expenditures and annual percentage change in the Ontario region, as follows:
| Ontario | 2010 to 2011 | 2011 to 2012 | 2012 to 2013 | 2013 to 2014 | 2014 to 2015 | 2015 to 2016 | 2016 to 2017 | 2017 to 2018 | 2018 to 2019 | 2019 to 2020 |
|---|---|---|---|---|---|---|---|---|---|---|
| Total expenditures ($M) | $174,653 | $180,778 | $186,544 | $193,929 | $203,043 | $215,738 | $231,663 | $250,947 | $269,127 | $287,643 |
| Total benefits annual % change | -0.5% | 3.5% | 3.2% | 4.0% | 4.7% | 6.3% | 7.4% | 8.3% | 7.2% | 6.9% |
Figure 8.3.2: Annual expenditures by benefit ($ 000's)
| Ontario | 2010 to 2011 | 2011 to 2012 | 2012 to 2013 | 2013 to 2014 | 2014 to 2015 | 2015 to 2016 | 2016 to 2017 | 2017 to 2018 | 2018 to 2019 | 2019 to 2020 |
|---|---|---|---|---|---|---|---|---|---|---|
| Transportation | $52,358 | $54,725 | $59,251 | $62,865 | $65,781 | $67,772 | $74,890 | $86,091 | $98,605 | $106,638 |
| Pharmacy | $73,887 | $76,430 | $77,131 | $78,510 | $81,982 | $88,872 | $94,101 | $99,550 | $100,558 | $104,760 |
| Dental | $40,594 | $41,848 | $42,259 | $43,972 | $46,759 | $49,903 | $52,105 | $52,055 | $53,667 | $55,386 |
| Mental health | $2,632 | $2,349 | $2,490 | $2,862 | $2,803 | $3,021 | $4,091 | $6,028 | $9,053 | $12,116 |
| Vision care | $5,183 | $5,425 | $5,412 | $5,721 | $5,717 | $6,160 | $6,223 | $6,848 | $6,744 | $7,860 |
| Other health care | $0 | $0 | $0 | $0 | $2 | $11 | $254 | $375 | $500 | $883 |
| Total | $174,653 | $180,778 | $186,544 | $193,929 | $203,043 | $215,738 | $231,663 | $250,947 | $269,127 | $287,643 |
| Source: FST adapted by Business Support, Audit and Negotiations Division | ||||||||||
Figure 8.4: Manitoba
Annual expenditures in Manitoba for 2019 to 2020 totalled $352.0 million, an increase of 9.7% from the $321.0 million spent in 2018 to 2019. Pharmacy expenditures in 2019 to 2020 increased by 10.6% to $112.0 million, while medical transportation costs increased by 7.5% to $168.7 million. Dental expenditures increased by 9.4% to $52.6 million. Mental health expenditures increased by 18.2% while vision care expenditures increased by 47.6%.
Unlike most other regions, pharmacy expenditures in Manitoba do not represent the largest proportion of total expenditures. Due to the higher proportion of clients living in northern or remote communities in Manitoba, medical transportation expenditures comprised almost half of the Manitoba region's total expenditures at 47.9%. Pharmacy costs ranked second at 31.8%, followed by dental at 15.0%. Mental health and vision care expenditures accounted for 3.3% and 2.0% of total expenditures respectively.
Figure 8.4.1: Percentage change in Manitoba region NIHB expenditures ($ 000's)
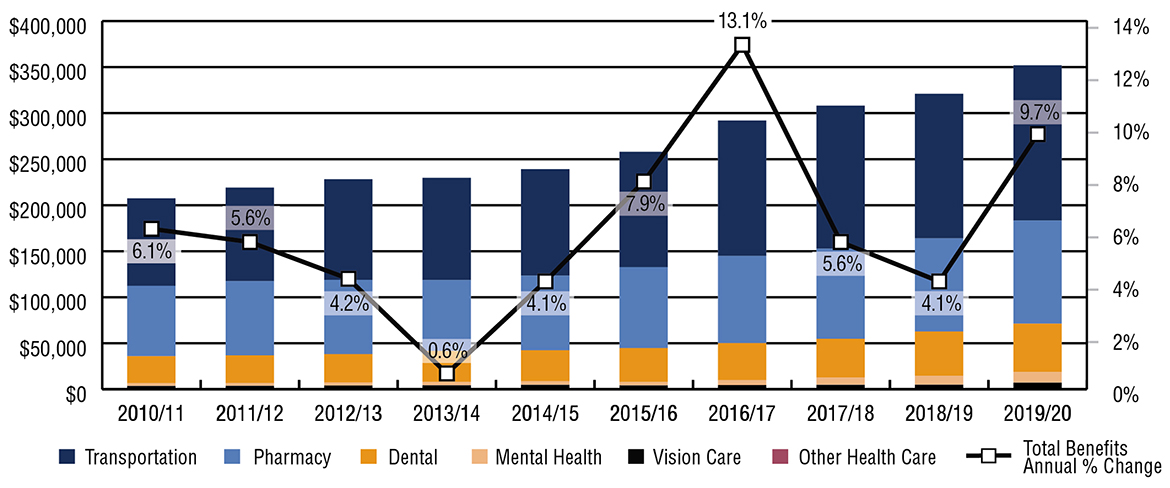
Source: FST adapted by Business Support, Audit and Negotiations Division
Text alternative for Figure 8.4.1: Percentage change in Manitoba region NIHB expenditures ($ 000's)
This image visually describes NIHB expenditures and annual percentage change in the Manitoba region, as follows:
| Manitoba | 2010 to 2011 | 2011 to 2012 | 2012 to 2013 | 2013 to 2014 | 2014 to 2015 | 2015 to 2016 | 2016 to 2017 | 2017 to 2018 | 2018 to 2019 | 2019 to 2020 |
|---|---|---|---|---|---|---|---|---|---|---|
| Total expenditures ($M) | $207,377 | $219,031 | $228,295 | $229,670 | $239,190 | $258,077 | $291,989 | $308,208 | $320,953 | $351,983 |
| Total benefits annual % change | 6.1% | 5.6% | 4.2% | 0.6% | 4.1% | 7.9% | 13.1% | 5.6% | 4.1% | 9.7% |
Figure 8.4.2: Annual expenditures by benefit ($ 000's)
| Manitoba | 2010 to 2011 | 2011 to 2012 | 2012 to 2013 | 2013 to 2014 | 2014 to 2015 | 2015 to 2016 | 2016 to 2017 | 2017 to 2018 | 2018 to 2019 | 2019 to 2020 |
|---|---|---|---|---|---|---|---|---|---|---|
| Transportation | $94,940 | $101,609 | $109,409 | $111,016 | $115,705 | $125,308 | $147,167 | $155,370 | $156,961 | $168,686 |
| Pharmacy | $76,496 | $80,639 | $80,676 | $77,034 | $81,059 | $87,997 | $94,757 | $98,046 | $101,250 | $112,025 |
| Dental | $29,399 | $29,861 | $30,734 | $33,649 | $33,527 | $36,764 | $39,986 | $41,949 | $48,099 | $52,622 |
| Mental health | $2,930 | $3,109 | $3,429 | $3,622 | $4,099 | $3,780 | $5,635 | $8,124 | $9,705 | $11,475 |
| Vision care | $3,612 | $3,813 | $4,048 | $4,348 | $4,800 | $4,212 | $4,204 | $4,479 | $4,699 | $6,935 |
| Other health care | $0 | $0 | $0 | $0 | $0 | $17 | $240 | $240 | $240 | $240 |
| Total | $207,377 | $219,031 | $228,295 | $229,670 | $239,190 | $258,077 | $291,989 | $308,208 | $320,953 | $351,983 |
| Source: FST adapted by Business Support, Audit and Negotiations Division | ||||||||||
Figure 8.5: Saskatchewan
Annual expenditures in Saskatchewan for 2019 to 2020 totalled $290.4 million, an increase of 9.5% from the $265.1 million spent in 2018 to 2019.
Saskatchewan is the region with the highest expenditures in pharmacy, followed closely by Manitoba and Ontario. In Saskatchewan, pharmacy expenditures increased by 7.4% to $127.0 million, while medical transportation costs increased by 11.4% to $83.9 million and dental expenditures increased by 3.7% to $57.6 million. Mental health and vision care expenditures increased by 49.8% and 25.8% respectively.
Pharmacy expenditures comprised the largest portion of the Saskatchewan's total expenditures at 43.7, medical transportation costs ranked second at 28.9%, followed by dental at 19.8%. Vision care and mental health expenditures accounted for 4.1% and 3.4% of total expenditures respectively.
Figure 8.5.1: Percentage change Saskatchewan NIHB expenditures ($ 000's)
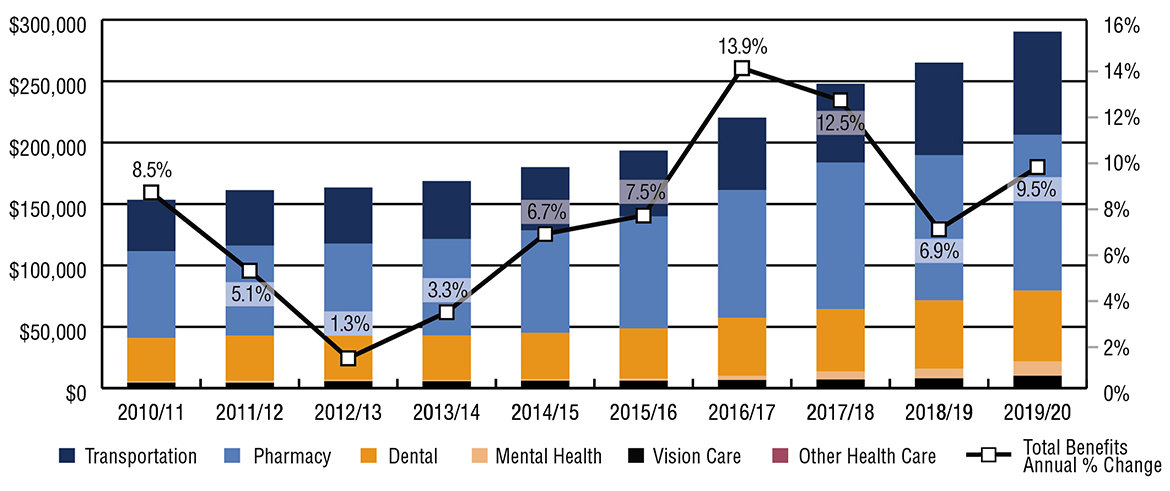
Source: FST adapted by Business Support, Audit and Negotiations Division
Text alternative for Figure 8.5.1: Percentage change Saskatchewan NIHB expenditures ($ 000's)
This image visually describes NIHB expenditures and annual percentage change in the Saskatchewan region, as follows:
| Saskatchewan | 2010 to 2011 | 2011 to 2012 | 2012 to 2013 | 2013 to 2014 | 2014 to 2015 | 2015 to 2016 | 2016 to 2017 | 2017 to 2018 | 2018 to 2019 | 2019 to 2020 |
|---|---|---|---|---|---|---|---|---|---|---|
| Total expenditures ($M) | $153,393 | $161,265 | $163,372 | $168,752 | $180,000 | $193,502 | $220,352 | $247,997 | $265,082 | $290,386 |
| Total benefits annual % change | 8.5% | 5.1% | 1.3% | 3.3% | 6.7% | 7.5% | 13.9% | 12.5% | 6.9% | 9.5% |
Figure 8.5.2: Annual expenditures by benefit ($ 000's)
| Saskatchewan | 2010 to 2011 | 2011 to 2012 | 2012 to 2013 | 2013 to 2014 | 2014 to 2015 | 2015 to 2016 | 2016 to 2017 | 2017 to 2018 | 2018 to 2019 | 2019 to 2020 |
|---|---|---|---|---|---|---|---|---|---|---|
| Transportation | $41,896 | $45,084 | $45,793 | $47,180 | $51,543 | $53,566 | $58,902 | $64,363 | $75,330 | $83,947 |
| Pharmacy | $70,625 | $73,293 | $74,646 | $78,546 | $83,361 | $91,170 | $104,082 | $119,326 | $118,250 | $126,963 |
| Dental | $35,317 | $36,941 | $36,219 | $36,399 | $37,679 | $41,028 | $47,321 | $50,635 | $55,603 | $57,639 |
| Mental health | $896 | $1,499 | $1,038 | $1,017 | $1,351 | $1,631 | $3,304 | $6,559 | $7,867 | $11,783 |
| Vision care | $4,658 | $4,449 | $5,676 | $5,611 | $6,066 | $6,104 | $6,533 | $6,905 | $7,822 | $9,844 |
| Other health care | $0 | $0 | $0 | $0 | $0 | $4 | $210 | $210 | $210 | $210 |
| Total | $153,393 | $161,265 | $163,372 | $168,752 | $180,000 | $193,502 | $220,352 | $247,997 | $265,082 | $290,386 |
| Source: FST and FIRMS adapted by Business Support, Audit and Negotiations Division | ||||||||||
Figure 8.6: Alberta region: 2009 to 2010 to 2018 to 2019
Annual expenditures in Alberta for 2019 to 2020 totalled $232.2 million, an increase of 11.0% from the $209.1 million spent in 2018 to 2019. Pharmacy expenditures increased by 12.8% to $93.8 million, while medical transportation costs increased by 8.4% to $61.7 million and dental expenditures increased by 6.5% to $55.0 million. Mental health expenditures increased by 15.4% and vision care expenditures increased by 36.6%.
Pharmacy expenditures accounted for 40.4% of Alberta's total expenditures. Medical transportation costs ranked second at 26.6%, followed closely by dental at 23.7%. Mental health and vision care expenditures accounted for 4.7% and 4.5% of total expenditures respectively.
Figure 8.6.1: Percentage change in Alberta region NIHB expenditures ($ 000's)
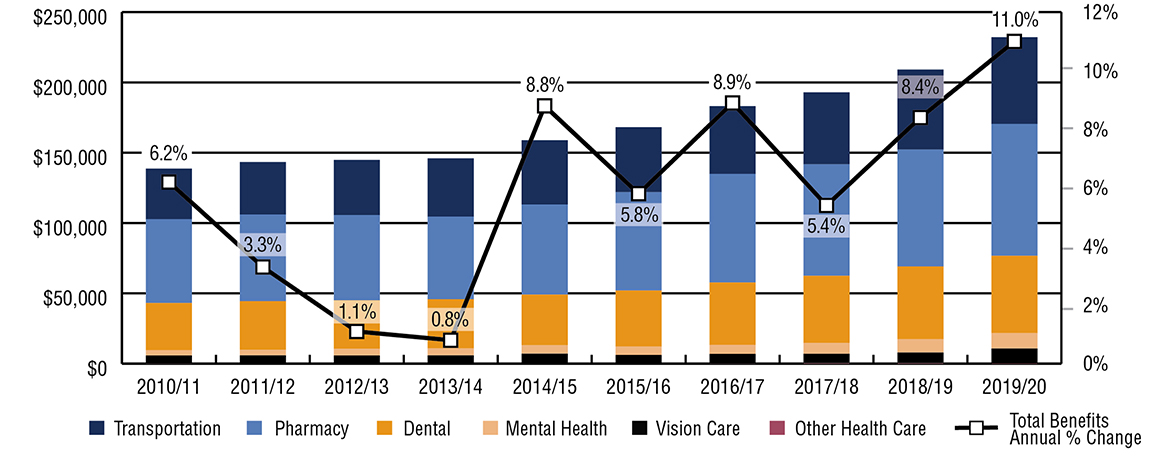
Source: FST adapted by Business Support, Audit and Negotiations Division
Text alternative for Figure 8.6.1: Percentage change in Alberta region NIHB expenditures ($ 000's)
This image visually describes NIHB expenditures and annual percentage change in the Alberta region, as follows:
| Alberta | 2010 to 2011 | 2011 to 2012 | 2012 to 2013 | 2013 to 2014 | 2014 to 2015 | 2015 to 2016 | 2016 to 2017 | 2017 to 2018 | 2018 to 2019 | 2019 to 2020 |
|---|---|---|---|---|---|---|---|---|---|---|
| Total expenditures ($M) | $138,717 | $143,313 | $144,928 | $146,051 | $158,911 | $168,211 | $183,108 | $192,983 | $209,122 | $232,177 |
| Total benefits annual % change | 6.2% | 3.3% | 1.1% | 0.8% | 8.8% | 5.8% | 8.9% | 5.4% | 8.4% | 11.0% |
Figure 8.6.2: Annual expenditures by benefit ($ 000's)
| Alberta | 2010 to 2011 | 2011 to 2012 | 2012 to 2013 | 2013 to 2014 | 2014 to 2015 | 2015 to 2016 | 2016 to 2017 | 2017 to 2018 | 2018 to 2019 | 2019 to 2020 |
|---|---|---|---|---|---|---|---|---|---|---|
| Transportation | $35,877 | $37,371 | $39,216 | $41,451 | $45,756 | $46,252 | $48,157 | $51,187 | $56,870 | $61,669 |
| Pharmacy | $59,738 | $61,621 | $60,584 | $58,777 | $64,087 | $69,992 | $77,265 | $79,343 | $83,103 | $93,776 |
| Dental | $33,421 | $34,543 | $34,501 | $34,928 | $35,974 | $39,753 | $44,315 | $47,637 | $51,617 | $54,993 |
| Mental health | $3,903 | $3,957 | $4,791 | $4,959 | $6,010 | $6,003 | $6,444 | $7,761 | $9,545 | $11,020 |
| Vision care | $5,778 | $5,822 | $5,836 | $5,936 | $7,084 | $6,207 | $6,928 | $6,764 | $7,696 | $10,514 |
| Other health care | $0 | $0 | $0 | $0 | $0 | $3 | $0 | $291 | $291 | $204 |
| Total | $138,717 | $143,313 | $144,928 | $146,051 | $158,911 | $168,211 | $183,108 | $192,983 | $209,122 | $232,177 |
| Source: FST and FIRMS adapted by Business Support, Audit and Negotiations Division | ||||||||||
Figure 8.7: Northern region
Annual expenditures in the Northern region for 2019 to 2020 totalled $143.0 million, an increase of 6.3 % from the $134.5 million spent in 2018 to 2019.
Medical transportation expenditures in 2019 to 2020 increased by 8.2% to $76.6 million while pharmacy costs increased by 5.2% to $33.2 million. Dental expenditures increased by 1.3% to $26.5 million. Vision care expenditures increased by 5.8% and mental health expenditures decreased by 0.2%.
Similar to Manitoba, medical transportation expenditures comprised the largest portion of the Northern region's total expenditures at 53.6%. Pharmacy costs ranked second at 23.2%, followed by dental at 18.6%. Vision care and mental health expenditures accounted for 2.7% and 1.5% of total expenditures respectively.
Figure 8.7.1: Percentage change in Northern region NIHB expenditures ($ 000's)
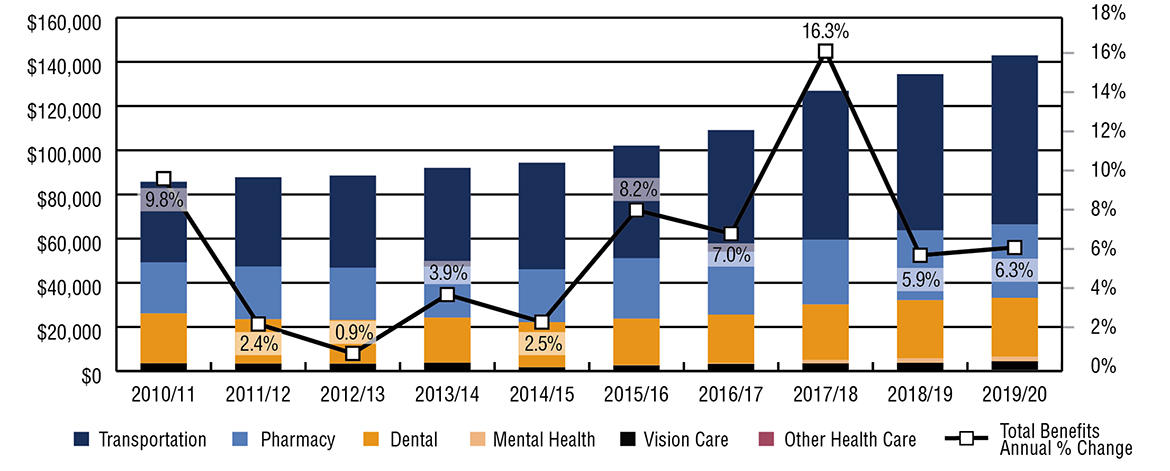
Source: FST adapted by Business Support, Audit and Negotiations Division
Text alternative for Figure 8.7.1: Percentage change in Northern region NIHB expenditures ($ 000's)
This image visually describes NIHB expenditures and annual percentage change in the Northern region, as follows:
| Northern region | 2010 to 2011 | 2011 to 2012 | 2012 to 2013 | 2013 to 2014 | 2014 to 2015 | 2015 to 2016 | 2016 to 2017 | 2017 to 2018 | 2018 to 2019 | 2019 to 2020 |
|---|---|---|---|---|---|---|---|---|---|---|
| Total expenditures ($M) | $85,744 | $87,787 | $88,557 | $92,027 | $94,343 | $102,040 | $109,157 | $126,933 | $134,474 | $142,961 |
| Total benefits annual % change | 9.8% | 2.4% | 0.9% | 3.9% | 2.5% | 8.2% | 7.0% | 16.3% | 5.9% | 6.3% |
Figure 8.7.2: Annual expenditures by benefit ($ 000's)
| Northern region | 2010 to 2011 | 2011 to 2012 | 2012 to 2013 | 2013 to 2014 | 2014 to 2015 | 2015 to 2016 | 2016 to 2017 | 2017 to 2018 | 2018 to 2019 | 2019 to 2020 |
|---|---|---|---|---|---|---|---|---|---|---|
| Transportation | $36,464 | $40,455 | $41,727 | $44,703 | $48,246 | $50,940 | $55,125 | $67,413 | $70,806 | $76,601 |
| Pharmacy | $23,190 | $23,863 | $23,682 | $23,144 | $23,941 | $27,408 | $28,488 | $29,373 | $31,571 | $33,220 |
| Dental | $22,537 | $20,079 | $19,773 | $20,415 | $20,413 | $20,936 | $21,966 | $25,141 | $26,211 | $26,546 |
| Mental health | $2 | $4 | $4 | $2 | $0 | $191 | $362 | $1,528 | $2,172 | $2,167 |
| Vision care | $3,550 | $3,387 | $3,370 | $3,763 | $1,743 | $2,564 | $3,217 | $3,131 | $3,713 | $3,929 |
| Other health care | $0 | $0 | $0 | $0 | $1 | $1 | $0 | $346 | $1 | $498 |
| Total | $85,744 | $87,787 | $88,557 | $92,027 | $94,343 | $102,040 | $109,157 | $126,933 | $134,474 | $142,961 |
| Source: FST adapted by Business Support, Audit and Negotiations Division | ||||||||||
Section 9: NIHB program administration
Figure 9.1: Non-insured health benefits administration costs ($ 000's): 2019 to 2020
Figure 9.1 provides the program administration expenditures by region as well as NIHB headquarters (HQ) in Ottawa. In 2019 to 2020, total NIHB administration costs were $75.8 million representing an increase of 16.9% over the previous fiscal year.
The roles of NIHB headquarters include:
- program policy development and determination of eligible benefits
- development and maintenance of the HICPS system and other national systems such as the Medical Transportation Reporting System (MTRS)
- claims verification and provider negotiations
- adjudicating benefit requests through the NIHB Drug Exception Centre and the Dental Predetermination Centre
- providing expert advice through the MS&E Review Centre and
- maintaining relationships with partner organizations at the national level as well as with other federal departments and agencies.
The roles of the NIHB regional offices include:
- adjudicating benefit requests for medical transportation, medical supplies and equipment, vision care, and mental health counselling benefits
- maintaining relationships with partner organizations at the provincial/territorial level as well as with provincial/territorial officials
Claims processing contract costs are related to the administration of pharmacy, medical supplies and equipment and dental benefits through the Health Information and Claims Processing Services (HICPS) system, and include:
- claim processing and payment operations
- claim adjudication and reporting systems development and maintenance
- provider registration and communications
- systems in support of pharmacy and MS&E benefits prior approval and dental predetermination processes
- provider verification programs and recoveries and
- standard and ad hoc reporting.
Figure 9.1: NIHB program administration expenditures by region ($ 000's)
| Categories | Atlantic | Quebec | Ontario | Manitoba | Saskatchewan | Alberta | Northern region | Headquarters | Total |
|---|---|---|---|---|---|---|---|---|---|
| Salaries | $1,446 | $1,757 | $4,359 | $3,095 | $3,781 | $3,516 | $1,445 | $15,626 | $35,025 |
| EBP | $387 | $471 | $1,177 | $836 | $1,021 | $949 | $390 | $4,206 | $9,436 |
| Operating | $113 | $68 | $115 | $126 | $175 | $189 | $226 | $2,574 | $3,585 |
| Subtotal | $1,946 | $2,296 | $5,650 | $4,057 | $4,977 | $4,654 | $2,060 | $22,406 | $48,045 |
| Claims processing contract costs | $27,750 | ||||||||
| Total administration costs | $75,795 | ||||||||
| Source: FST adapted by Business Support, Audit and Negotiations Division | |||||||||
Figure 9.2: Non-Insured Health Benefits administration costs as a proportion of benefit expenditures ($ millions)
Figure 9.2 provides the percentage of NIHB program administrative costs as a proportion of overall NIHB benefit expenditures. In 2019 to 2020, total NIHB benefit expenditures were $1,519.5 million, of which direct benefit expenditures totaled $1,491.7 million and expenditures for claims processing administration amounted to $27.7 million. An additional $48.0 million was spent on salaries and operating costs associated with program administration.
Total NIHB program administration costs ($75.8 million, including claims processing and other program administration) as a proportion of direct benefit expenditures ($1.4 billion), was 5.1% in 2019 to 2020. Over the past 5 fiscal years, the percentage of NIHB program administrative costs as a proportion of total benefit expenditures has ranged from a high of 5.1% in 2019 to 2020 to a low of 4.7% the previous 3 fiscal years.
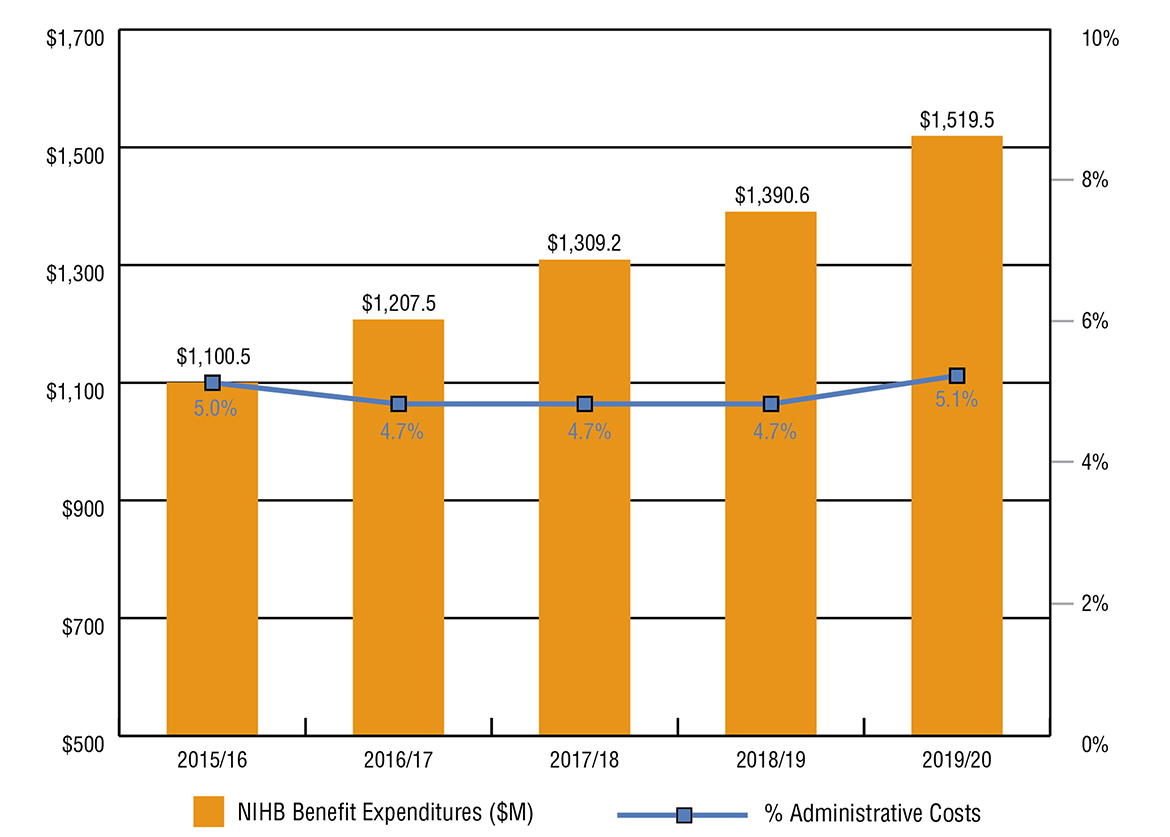
Source: FST and FIRMS, adapted by Business Support, Audit and Negotiations Division
Text alternative for Figure 9.2: Non-Insured Health Benefits administration costs as a proportion of benefit expenditures ($ millions)
This image visually describes annual NIHB program costs and the percentage of which is administrative costs, as follows:
| Fiscal year | NIHB benefit expenditures ($M) | % Administrative costs |
|---|---|---|
| 2015 to 2016 | $1,100.5 | 5.0% |
| 2016 to 2017 | $1,207.5 | 4.7% |
| 2017 to 2018 | $1,309.2 | 4.7% |
| 2018 to 2019 | $1,390.2 | 4.7% |
| 2019 to 2020 | $1,519.5 | 5.1% |
Section 9.3: Health Information and Claims Processing Services (HICPS): 2019 to 2020
Claims for the NIHB program pharmacy, dental and medical supplies and equipment (MS&E) benefits provided to eligible First Nations and Inuit clients are processed via the Health Information and Claims Processing Services (HICPS) system. HICPS includes administrative services and programs, technical support and automated information management systems used to process and pay claims in accordance with NIHB program client/benefit eligibility and pricing policies.
Since 1990, the NIHB program has retained the services of a private sector contractor to administer the following core claims processing services on its behalf:
- claim processing and payment operations
- claim adjudication and reporting systems development and maintenance
- provider registration and communications
- systems in support of pharmacy and MS&E benefits prior approval and dental predetermination processes
- provider audit programs and audit recoveries and
- standard and ad hoc reporting
The current HICPS contract is with Express Scripts Canada. This contract came into force on December 6, 2009, following a competitive contracting process led by Public Works and Government Services Canada (PWGSC). The NIHB program manages the HICPS contract as the project authority in conjunction with PWGSC, the contract authority.
As of March 31, 2020, there were 27,317 active providers* registered with the HICPS claims processor to deliver NIHB pharmacy, MS&E and dental benefits. The number of active providers by region and by benefit is outlined in the table below. The number of claims settled through the HICPS system is highlighted in Figure 9.3.2.
An active provider refers to a provider who has submitted at least one claim in the 24 months prior to March 31, 2020.
Figure 9.3.1: Number of NIHB providers by region and benefit: April 2018 to March 2020
| Region | Pharmacy | MS&E | Dental |
|---|---|---|---|
| Atlantic | 786 | 214 | 1,060 |
| Quebec | 1,783 | 182 | 3,025 |
| Ontario | 3,930 | 702 | 6,457 |
| Manitoba | 445 | 92 | 808 |
| Saskatchewan | 425 | 122 | 593 |
| Alberta | 1,543 | 279 | 2,652 |
| British Columbia | 864 | 47 | 1,074 |
| Yukon | 9 | 8 | 50 |
| Northwest Territories | 11 | 6 | 61 |
| Nunavut | 7 | 10 | 72 |
| Total | 9,803 | 1,662 | 15,852 |
| Source: HICPS adapted by Business Support, Audit and Negotiations Division | |||
Figure 9.3.2: Number of claim lines settled through the Health Information and Claims Processing Services (HICPS) system: 2019 to 2020
Figure 9.3.2 sets out the total number of pharmacy, dental and MS&E claims settled through the HICPS system in fiscal year 2019 to 2020. During this period, a total of 29,229,020 claim lines were processed through HICPS, an increase of 7.1% over the previous fiscal year. Ontario had the highest volume of total claims processed at 7.9 million, followed by Manitoba at 5.3 million and Saskatchewan at 4.9 million.
Claim lines and prescriptions
It is important to note that the program reports annually on claim lines. This is an administrative unit of measure as opposed to a health care unit of measure. A claim line represents a transaction in the claims processing system and is not equivalent to a prescription. Prescriptions can contain a number of different drugs with each one represented by a separate claim line. Prescriptions for a number of drugs may be repeated and refilled many times throughout the year. In the case of repeating prescriptions, each time a prescription is refilled, the system will log another transaction (claim line). Therefore, it is possible for an individual who has a prescription that repeats multiple times in a year to have numerous related claim lines associated with the single prescription. Some prescriptions, such as methadone) are dispensed daily and will increase the number of claim lines.
Figure 9.3.2: Number of claim lines processed through HICPS by region and benefit
| Region | Pharmacy | Dental | MS&E | Total |
|---|---|---|---|---|
| Atlantic | 1,714,413 | 182,524 | 52,589 | 1,949,526 |
| Quebec | 3,313,264 | 226,516 | 41,220 | 3,581,000 |
| Ontario | 7,197,495 | 643,179 | 59,732 | 7,900,406 |
| Manitoba | 4,686,989 | 545,364 | 112,270 | 5,344,623 |
| Saskatchewan | 4,167,948 | 614,328 | 118,398 | 4,900,674 |
| Alberta | 3,453,669 | 590,054 | 74,171 | 4,117,894 |
| British Columbia | 168,349 | 33,196 | 2,177 | 203,722 |
| Yukon | 139,725 | 23,785 | 4,007 | 167,517 |
| Northwest Territories | 406,216 | 104,880 | 12,963 | 524,059 |
| Nunavut | 376,538 | 144,148 | 18,913 | 539,599 |
| Total claim lines | 25,624,606 | 3,107,974 | 496,440 | 29,229,020 |
| Source: HICPS adapted by Business Support, Audit and Negotiations Division | ||||
Section 9.4: Benefits management
Open benefits are drugs listed on the Drug benefit list, which do not have established criteria, gender or age limitations, or prior approval requirements. This means that, in most cases, pharmacy providers may submit claims for dispensing open benefit drugs without receiving prior approval requirements. Some items or services require prior approval from NIHB to ensure that they meet criteria for coverage.
Drug Exception Centre (DEC)
The DEC is a single call centre that provides efficient responses to all requests for drugs that are not on the NIHB Drug Benefit List or require prior approval, for extemporaneous mixtures containing exception or Limited Use (LU) drugs, for prescriptions on which prescribers have indicated "no substitution," and for claims that exceed $1,999.99. Figure 9.4 shows the volume of requests made to the DEC in 2019 to 2020.
Figure 9.4: Volume of requests and approvals made to the DEC by benefit listing type*
| Status | Open benefit (unrestricted) | Open benefit (restricted) | Exceptions | Limited use | Total |
|---|---|---|---|---|---|
| Total requested | 24,548 | 10,281 | 14,589 | 52,694 | 102,112 |
| Total approved | 21,075 | 9,735 | 8,829 | 40,299 | 79,938 |
| Source: HICPS adapted by Business Support, Audit and Negotiations Division | |||||
* Benefit listing type refers to a drug product's status on the NIHB Drug Benefit List (DBL), and are defined as follows:
- Open benefit (unrestricted): Drugs included on the NIHB DBL for which the total dollar value is more than the point of sale limit, the pre-determined frequency limit has been reached or for which more than a 3 month supply is requested.
- Open benefit (restricted): Drugs included on the NIHB Drug Benefit List which have been restricted due to safety concerns. These drugs are part of the Problematic Substance Use Strategy, such as opioids, benzodiazepines, stimulants and gabapentin.
- Exceptions: Exception drugs are drug products which are not listed in the Drug benefit list. These drug products may be approved in special circumstances upon receipt of a completed "Exception Drugs Request Form" from the licensed prescriber.
- Limited use: Limited use benefits are drug products listed on the Drug benefit list that may not be appropriate for general listing, but have value in specific circumstances. These products will have specific criteria for provision as a benefit under the NIHB program.
The DEC also supports the implementation of the Problematic Substance Use Strategy to address and prevent potential misuse of prescription drugs. The program has set limits on medications of concern, and developed a structured approach towards client safety which includes the implementation of the Client Safety Program across the country.
Dental Predetermination Centre
The Dental Predetermination Centre (DPC) is a call centre that provides efficient adjudication of all dental and orthodontic predetermination, post-determination and appeals. In addition, the DPC is responsible for addressing client and provider inquiries, and to assist clients and providers with the submission of the predetermination, post-determination, client reimbursement and appeal requests.
Medical Supplies and Equipment Review Centre
NIHB staff at the regional level manage prior approval of medical supplies and equipment benefit requests, with support from the MS&E Review Centre (MSERC) at the NIHB national office. The MSERC is staffed in-house by various health professionals, including registered nurses. In cases where advice is required by a particular specialist, such as an audiologist or an orthotist, information is forwarded to the appropriate specialist consultant for review. Consultants make their recommendations based upon the current standards of practice, best practices, current scientific evidence, program policy and recommended guidelines within their field of specialty.
Section 9.5: Claims verification activities: 2019 to 2020
As part of risk management activities for the NIHB program, Indigenous Services Canada has mandated its claims processor to maintain a set of pre-payment and post-payment processes, including claims verification activities.
During 2019 to 2020, the claims processor carried out claims verifications as directed by the NIHB program. The verifications address the need of the NIHB program to comply with accountability requirements for the use of public funds and to ensure provider compliance with the terms and conditions of the program as outlined in the appropriate NIHB Provider Guide, Claims Submission Kit, Provider Agreement and other relevant documents.
There are 4 components within claims verification activities for the pharmacy, medical supplies and equipment and dental benefit areas. These are:
- Next Day Claims Verification (NDCV) program, which consists of a review of a defined sample of claims submitted by providers the day following receipt by the claims processor
- Client Confirmation Program (CCP), which consists of a monthly mail-out to a randomly selected sample of NIHB clients to confirm the receipt of the benefit that has been billed on their behalf
- On-Site claim verification program, which consists of the selection of a sample of claims for administrative validation with a provider's records through an on-site visit
- Desk claim verification program, which consists of the selection of a sample of claims for administrative validation with a provider's records. Unlike on-site verifications, a desk claim verification serves to validate records through the use of fax or mail.
Completion of the claim verification process often spans more than one fiscal year. Although the complete recovery for any verification may overlap into another fiscal year, recoveries from claims verification activities are recorded in the fiscal year in which they are received.
The following figures identify recoveries from all components of the verification process during the 2019 to 2020 fiscal year.
Figure 9.5.1: Dental claims verification recoveries by region: 2019 to 2020
| Region | Verifications completed | Recoveries | NDCV/CCP savings | Total recoveries/savings |
|---|---|---|---|---|
| Atlantic | 0 | $0 | $19,094 | $19,094 |
| Quebec | 0 | $7,307 | $6,504 | $13,811 |
| Ontario | 0 | $0 | $39,904 | $39,904 |
| Manitoba | 1 | $2,264 | $13,877 | $16,141 |
| Saskatchewan | 0 | $0 | $16,871 | $16,871 |
| Alberta | 1 | $60,325 | $13,220 | $73,545 |
| Yukon | 0 | $0 | $334 | $334 |
| N.W.T. | 0 | $0 | $1,688 | $1,688 |
| Nunavut | 0 | $0 | $0 | $0 |
| Total | 2 | $69,895 | $111,492 | $181,387 |
| Source: Electronic Scripts Canada adapted by Business Support, Audit and Negotiations Division | ||||
Figure 9.5.2: Pharmacy claims verification recoveries by region: 2019 to 2020
| Region | Verifications completed | Recoveries | NDCV/CCP savings | Total recoveries/ savings |
|---|---|---|---|---|
| Atlantic | 0 | $0 | $147,189 | $147,189 |
| Quebec | 5 | $126,715 | $115,988 | $242,703 |
| Ontario | 2 | $63,645 | $499,104 | $562,749 |
| Manitoba | 1 | $6,523 | $151,899 | $158,422 |
| Saskatchewan | 0 | $51,528 | $74,450 | $125,978 |
| Alberta | 1 | $198 | $177,129 | $177,327 |
| Yukon | 0 | $0 | $5,657 | $5,657 |
| N.W.T. | 0 | $0 | $17,470 | $17,470 |
| Nunavut | 0 | $0 | $54,764 | $54,764 |
| Total | 9 | $248,610 | $1,243,651 | $1,492,261 |
| Source: Express Scripts Canada adapted by Business Support, Audit and Negotiations Division | ||||
Figure 9.5.2: Medical supplies and equipment claims verification recoveries by region: 2019 to 2020
| Region | Verifications completed | Recoveries | NDCV/CCP savings | Total recoveries/savings |
|---|---|---|---|---|
| Atlantic | 0 | $0 | $19,094 | $19,094 |
| Quebec | 0 | $7,307 | $6,504 | $13,811 |
| Ontario | 0 | $0 | $39,904 | $39,904 |
| Manitoba | 1 | $2,264 | $13,877 | $16,141 |
| Saskatchewan | 0 | $0 | $16,871 | $16,871 |
| Alberta | 1 | $60,325 | $13,220 | $73,545 |
| Yukon | 0 | $0 | $334 | $334 |
| N.W.T. | 0 | $0 | $1,688 | $1,688 |
| Nunavut | 0 | $0 | $0 | $0 |
| Total | 2 | $69,895 | $111,492 | $181,387 |
| Source: Express Scripts Canada adapted by Business Support, Audit and Negotiations Division | ||||
Subsequent appeals to these reversals may lead to claims being paid in full to providers once appropriate billing and supporting documentation has been provided for review.
Section 10: NIHB policy and program initiatives
Section 10.1: Evidence-based policy development
NIHB Drug benefit listing and review
The NIHB Drug Benefits List (DBL) is a listing of all of the drugs provided as benefits by the NIHB program. Drugs considered for, or currently listed on, the DBL must meet established criteria. For example, they must be legally available for sale in Canada with a Notice of Compliance (NOC) and Drug Identification Number (DIN) or Natural Product Number (NPN), and be dispensed in a pharmacy. The drugs must also demonstrate evidence of therapeutic efficacy, safety, and incremental benefit in proportion to incremental cost.
The review process for drug products that are considered for inclusion as a benefit under the NIHB program varies depending on the type of drug submitted. Submissions for new chemical entities, new combination drug products and existing chemical entities with new indications, must be sent to the Canadian Agency for Drugs and Technologies in Health (CADTH), an independent organization that provides research and information about the effectiveness of drugs and other medical treatments.
Through the Common Drug Review (CDR) and pan-Canadian Oncology Drug Review (pCODR) processes, CADTH conducts objective evaluations of the clinical, economic, and patient evidence on drugs and medical technologies. Based on this information, the CADTH expert committees provide coverage recommendations and advice to Canada's public drug plans, including the NIHB program. The CDR and pCODR were established by federal, provincial and territorial public drug plans to reduce duplication of effort in reviewing drug submissions, to maximize the use of resources and expertise, and to enhance the consistency and quality of drug reviews.
NIHB Drugs and Therapeutics Advisory Committee (DTAC)
The NIHB DTAC is an advisory body of highly qualified health professionals who bring impartial and practical expert medical and pharmaceutical advice to the NIHB program to promote improvement in the health outcomes of First Nations and Inuit clients through effective use of pharmaceuticals. The approach is evidence-based and the advice reflects medical and scientific knowledge, current utilization trends, current clinical practice, health care delivery and client healthcare needs.
More information on DTAC and its members can be found on the Government of Canada's website at Drugs and Therapeutics Advisory Committee
NIHB Oral Health Advisory Committee (NOHAC)
The NIHB Oral Health Advisory Committee (NOHAC) supports the NIHB program by providing impartial expert advice on oral health matters as they pertain to Canada's First Nations and Inuit population. Through NOHAC, the NIHB program is able to access external professional expertise to inform and improve the criteria, guidelines and policies under which the program covers dental services provided to eligible First Nations and Inuit clients.
Section 10.2: Client safety
Pharmacy benefit client safety initiatives
Prescription drugs have the capacity to heal but also the capacity to do harm if not used correctly. Public drug plans, like NIHB, bear a responsibility to those they serve. The NIHB program places a high priority on client safety, and has a number of strategies in place to encourage the safe use of prescription medications.
Point of sale (POS) warning and rejection messages
The NIHB program sends messages electronically in real-time at the POS to warn pharmacy providers about potential client safety issues including drug interactions and repeat prescriptions. Certain warning messages also require the pharmacy providers to report back with specific codes that give the program information about the actions they have taken related to the warning code received.
The NIHB program also sends rejection messages to pharmacists when a client's claims history indicates potential misuse or overuse of a range of prescription medications. When a rejection message is received, a pharmacy provider must contact NIHB's Drug Exception Centre (DEC). The DEC will provide more information to the pharmacy provider regarding the reason for coverage rejection and follow up with the prescribing physician before the program will authorize coverage for the pharmacy benefit in question. The NIHB program may refuse coverage for pharmacy benefits when there is evidence that suggests client safety may be at risk.
An example of a rejection message is when a client exceeds the maximum allowable quantities for acetaminophen and acetaminophen-based opioids. Clients are often unaware of the long-term consequences of commonly available acetaminophen-based products. Negative health effects including serious liver damage can result from prolonged use, if recommended dosages are exceeded.
Another example of a rejection message is a code that was created to address the health risks associated with the misuse of specific drugs of concern. These drugs include opioids (such as morphine, codeine, and oxycodone which are used to relieve pain), benzodiazepines (so-called "minor" tranquilizers, sleep aids and anti-anxiety medications) and methadone (a long-acting synthetic opioid used to treat opioid use disorder or pain). In designing this warning message, it was important to recognize that all of these drugs have clinically valid applications. Therefore, the warning message was designed to focus attention on cases where there were concerns about potential misuse. This intervention addresses situations where clients access:
- 3 or more active prescriptions for benzodiazepines
- 3 or more opioids
- 3 or more benzodiazepines and 3 or more opioids
- a prescription for methadone in association with opioid-based drugs.
Trend analysis of prescription drug use
The NIHB program analyzes broad patterns of utilization, prescribing, and dispensing on an on-going basis. This work is conducted by a team of licensed pharmacists, pharmacy technicians and experts in data analysis. Once patterns are identified, the program intervenes to prevent the recurrence of inappropriate prescription drug use. NIHB's Prescription Drug Surveillance Strategy tracks how drugs like opioids, benzodiazepines and stimulants are prescribed and dispensed. NIHB has an electronic system that monitors claims for these drugs and lets health providers know if there is a concern. The goal of these measures is to protect client safety.
In January of 2007, NIHB launched the Client Safety Program (NIHB-CSP, formerly known as the Prescription Monitoring Program) which focuses on reducing client safety risks associated with problematic use of restricted medications such as benzodiazepines, opioids, gabapentin, and stimulant drugs. Clients are enrolled in the NIHB-CSP based on their patterns of prescription drug use. Additionally, clients treated for opioid use disorder with methadone, buprenorphine/naloxone (Suboxone and generics), long acting morphine (Kadian) or others are enrolled. Enrolment in the NIHB-CSP may restrict clients to a specific prescriber or group practice or require clients to have future claims verified and authorized by a pharmacist at NIHB's Drug Exception Centre.
The NIHB-CSP complements existing activities and promotes the optimal use of medications by allowing the program to enhance interventions when there are concerns about how a client is using their medications. The NIHB-CSP operates in all regions of Canada, with the exception of Quebec, and monitored the safety of nearly 22,600 clients in fiscal year 2019 to 2020.
Reduction in the opioid dose limit
To ensure appropriate opioid use amongst NIHB clients, beginning in September 2013, the NIHB program implemented an opioid dose limit for clients with chronic non-cancer/non-palliative pain. This limit is calculated based on the total daily dose of all opioids a client is receiving covered through the program. This limit was reduced to 200 mg of morphine equivalence per day at the end of 2017 as per the Canadian Guideline for Safe and Effective Use of Opioids for Chronic Non-Cancer Pain published in 2010, which states, "chronic non-cancer pain can be managed effectively in most patients with dosages at or below 200 mg/day of morphine or equivalent. Consideration of a higher dosage requires careful reassessment of the pain and of risk for opioid use disorder, and frequent monitoring with evidence of improved patient outcomes."
Benzodiazepine dose limit policy
For client safety, the NIHB program limits the maximum dose of benzodiazepines that may be reimbursed per month for a client. Since March 2013, the program has gradually been lowering the dose limit, which is currently at 30 mg of diazepam equivalents (DEQ) per day. Additionally, NIHB has a 30-day maximum dispense policy for all benzodiazepines.
Gabapentin and Pregabalin dose limit policy
For client safety, the NIHB program limits the maximum dose of gabapentin that may be reimbursed per month for a client. Since March 2013, the program has gradually been lowering the dose limit, which is currently at 3600 mg of gabapentin per day. Additionally, NIHB has a 30-day maximum dispense policy for gabapentin and pregabalin.
Coverage of naloxone
In addition to methadone, Suboxone, and Kadian to treat opioid use disorder, the NIHB program covers injectable and nasal naloxone, a medication that can temporarily reverse the toxic effects of opioid drugs (e.g. heroin, morphine, fentanyl). Medical help is still required after administration of naloxone. To improve access to this life saving medication, the program added injectable and nasal naloxone and injectable and nasal naloxone with administration supply (kit) as an open benefit on the Drug Benefit List. Individuals at risk of opioid toxicity and people close to them are encouraged to have a naloxone kit on hand, and the training to use it.
Section 10.3: Client and provider communications
NIHB is continually seeking ways to improve communications with clients, providers and partners regarding benefit coverage and administration.
The NIHB program regularly produces newsletters and updates to inform clients and providers about any changes to NIHB policy and benefit coverage. For example, NIHB enrolled providers for dental, pharmacy and MS&E receive policy updates and relevant information regarding benefits through both quarterly provider newsletters and fax broadcasts.
The provider newsletters are distributed to enrolled providers by Express Scripts Canada Indigenous Services Canada's claims processing contractor.
The NIHB website is a key venue for disseminating program information. NIHB program updates are produced quarterly to provide information for clients regarding changes to benefit coverage. They are also promoted through social media on the Government of Canada's Healthy First Nations and Inuit Facebook Page. NIHB develops additional posts for the Healthy First Nations and Inuit Facebook page that promote client awareness of their benefit coverage. Often these posts are planned in conjunction with broader public health promotion campaigns (for example, a post on diabetes awareness will include a reminder about NIHB coverage of diabetes medications and supplies, and a post on vision health that will include a reminder about NIHB coverage of eye exams).
NIHB strives to be accessible and responsive to clients. Clients can contact NIHB directly by calling Indigenous Services Canada regional offices, the NIHB Dental Predetermination Centre, or the NIHB Drug Exception Centre. In 2016, NIHB implemented new ways for clients to contact the program on-line: the Contact us web page for the NIHB program now provides an email address for direct inquiries to the NIHB program and the NIHB Feedback form enables clients to make inquiries or send feedback directly to the program.
Section 10.4 NIHB navigators
NIHB navigators help eligible clients to navigate and access the NIHB program. They are a resource for communities, organizations or individuals who need support or information on NIHB-related issues. Navigators are employed by regional First Nations and Inuit organizations. Their roles and activities are adapted to meet regional needs, and generally include the following:
- increase understanding of the NIHB program and share information on eligible benefits
- help clients and communities to resolve NIHB-related issues
- link with health departments and agencies to help improve client access to NIHB benefits and related health services.
Section 10.5: Collaboration with First Nations and Inuit partners
In 2014, the Government of Canada agreed to undertake a multi-year Joint Review of the NIHB program in partnership with the Assembly of First Nations (AFN). The overall objective of the review is to identify and implement actions that enhance client access to benefits, identify gaps in benefits, streamline service delivery to be more responsive to client needs, and increase program efficiencies. The Joint Review is guided by a Steering Committee comprised of First Nations and Indigenous Services Canada's representatives.
As part of this process, the AFN conducted a robust program of client, provider and stakeholder engagement activities to gather broad input and perspectives that will inform recommendations for program improvements.
Indigenous Services Canada continues to work with Inuit representatives through the Inuit NIHB Senior Bilateral Committee (INSBC) to identify and address areas of concern and recommendations to improve the quality, access, and delivery of NIHB benefits to Inuit clients. NIHB updates Inuit partners regularly on progress made to advance INSBC priority issues, including working towards the implementation of NIHB navigator positions for Inuit clients in Nunavut and the Inuvialuit Settlement Region.
Section 11: Technical notes
Information contained in the 2019 to 2020 NIHB Annual Report has been extracted from several databases. All tables and charts are footnoted with the appropriate data sources. These data sources are considered to be of very high quality but, as in any administrative data set, some data may be subject to coding errors or other anomalies. For this reason, users of the data should always refer to the most current edition of the NIHB annual report. Please note that some table totals may not add due to rounding procedures.
To address reporting challenges related to NIHB clients registered to British Columbia bands but living elsewhere, and Inuit clients living in BC, select financial and utilization data relating to the British Columbia Region have been suppressed. National totals, however, include these values.
Fiscal year 2014 to 2015 expenditures totals for Alberta medical transportation, vision care and MSE benefits have been restated and differ from the expenditures totals that appeared in the 2014 to 2015 edition of the NIHB annual report.
Population data
First Nations and Inuit population data are drawn from the Status Verification System (SVS) which is operated by NIHB. SVS data on First Nations clients are based on information provided by Indigenous Services Canada (ISC). SVS data on Inuit clients are based on information provided by the Governments of the Northwest Territories and Nunavut, and Inuit organizations including the Inuvialuit Regional Corporation, Nunavut Tunngavik Incorporated and the Makivik Corporation.
Pharmacy and dental data
Two Indigenous Services Canada data systems provide information on the expenditures and utilization of the NIHB pharmacy and dental benefits. Financial Services and Training (FST) is the source of most of the expenditure data, while the Health Information and Claims Processing Services (HICPS) system provides detailed information on the utilization of the pharmacy (including MS&E) and dental benefit areas. Expenditure data prior to fiscal year 2019 to 2020 were collected from the Framework for Integrated Resource Management System (FIRMS).
Medical transportation data
Medical transportation financial data are provided through FST. Medical transportation data are also collected regionally through other electronic systems. Operational data at the regional level are tracked through the Medical Transportation Reporting System (MTRS) for most regions, while the Alberta region uses its own system. Contribution agreement data are also collected, but in a limited manner. In some communities, MTRS is used to collect contribution agreement data, while other communities report data using spreadsheet templates, in-house data management systems, or through paper reports.
The Medical Transportation Data Store (MTDS) serves as a repository for selected operational data, as well as the data collected from medical transportation contribution agreements, and ambulance data systems. The objective of the MTDS is to enable aggregate reporting on medical transportation at a national level in order to further strengthen program management, provide enhanced data analysis and reporting and aid in decision making.
Vision care, mental health counselling and other health care data
Financial data on the NIHB vision care, mental health counselling and other health care benefits are provided through FST.